Bar Graph for Market Trend Analysis – Effective Market Insights
RJ0400070_19
- Last Update 06/06/2025
- File Size 0.1MB
- # of Slides 2
- File Format PPTX
- Slide Ratio 16:9
- Color
Keywords
- #Content-Based Slides
- #Design-Based Slides
- #Market and Competitor Analysis
- #Graph
- #Market Analysis
- #Industry Trends
- #Column
- #Column Chart
- #16:9
- #vertical bar chart PowerPoint
- #bar graph slide template
- #market trend analysis chart
- #year-over-year comparison
- #trend visualization presentation
- #how to create bar chart in PowerPoint
About the Product
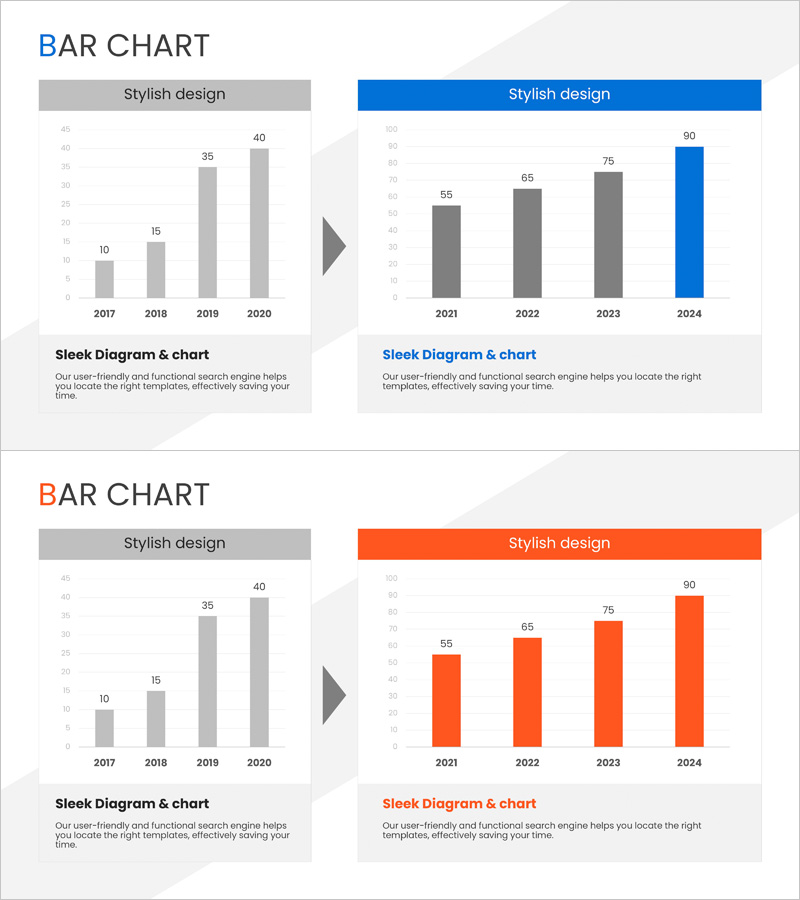
A vertical bar chart PowerPoint slide designed for market trend analysis and competitive performance comparison. Visualizes year-over-year data changes from 2017 to 2024 with a dual-tone color scheme—grayscale and blue/orange accent versions—to distinguish baseline and highlighted data. Each slide provides both a neutral grayscale version for print and a vibrant color version for digital presentations. Optimized for 16:9 widescreen format with 2-slide composition, ready for immediate customization and deployment.
Usage Points
-
Main Usage
Effectively compares year-over-year numerical changes and growth trajectories at a glance. Ideal for visualizing market size evolution, revenue trends, customer growth, and competitive benchmarking to strengthen decision-making narratives and stakeholder confidence.
-
How to Use
Use the grayscale version for printed materials and monochrome projection environments; deploy the color version for digital presentations and online sharing. Replace bar heights and values with your own data for instant completion. Colors, fonts, and labels are fully customizable to match your brand guidelines.
-
Recommended For
Marketing professionals presenting market analysis reports, sales teams showcasing performance metrics, executive briefings, investor pitch decks, and business plan market overview sections. Particularly effective when emphasizing year-over-year, quarterly, or monthly progression.
-
Slide Structure
Each slide features a title area, four vertical bars representing annual data points, Y-axis scale (0–100), X-axis year labels, and a descriptive text zone at the bottom. The grayscale version uses neutral gray bars; the color version highlights with blue and orange bars for visual emphasis and data differentiation.
Related Products
-

Modern Theme Bar Graph – Optimized Design for Market Analysis
#Market and Competitor Analysis #Graph #Market Analysis
-

Market Trend Analysis Bar Graph & Table
#Market and Competitor Analysis #Diagram #Graph
-

Vertical Bar PC Mockup Graph – Market and Competitive Analysis
#Market and Competitor Analysis #Graph #Other
-

Visualizing Market Analysis with Yearly Round Bar Graph
#Market and Competitor Analysis #Graph #Market Analysis
