Service Core Function Connection Diagram – Vision and Strategy
RM0700001_7
- Last Update 02/25/2025
- File Size 1.8MB
- # of Slides 2
- File Format PPTX
- Slide Ratio 16:9
- Color
Keywords
- #Content-Based Slides
- #Design-Based Slides
- #Product/Service Introduction
- #Business Vision and Strategy
- #Diagram
- #Composition
- #Core Competencies
- #Cluster
- #Chain Diagram
- #16:9
- #connection diagram PowerPoint
- #radial diagram slide template
- #core functions visualization
- #service architecture diagram
- #6-node connection chart
- #business process PowerPoint slide
About the Product
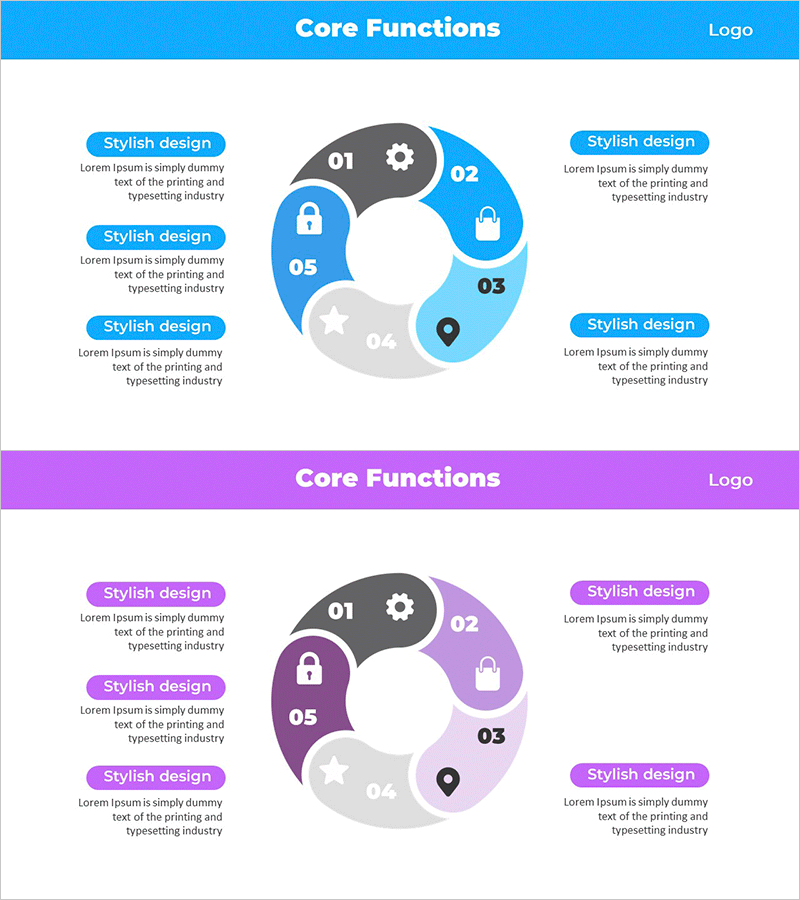
A radial connection diagram PowerPoint slide that visualizes six core service functions connected from a central hub. The structure clearly shows relationships and interactions between features through outward-expanding nodes. Bright blue and gray tones create distinct visual separation for each function, while icons (settings, lock, briefcase, location, star, and more) intuitively represent each item's characteristics. Ready to use in product and service introduction presentations, with editable text areas for customization across various business contexts.
Usage Points
-
Main Usage
Visualize service or product core functions through a radial structure expanding from a central hub, clearly showing functional connectivity and interactions. Ideal for investor presentations, client proposals, and strategic briefings to effectively communicate service architecture and value proposition.
-
How to Use
Enter the service name or core concept in the central circle, then add function names and descriptions to the six surrounding nodes. Maintain or customize the node icons and colors to match your brand identity. Use the two-slide layout with the first slide showing the diagram and the second providing detailed explanations.
-
Recommended For
Product managers, marketing professionals, sales presenters, executive report creators, startup fundraising teams. Applicable for service structure explanation, feature comparison, organizational role distribution, process flow visualization, and other business communication needs.
-
Slide Structure
Two-slide layout. First slide features a radial diagram with a central hub connected to six surrounding nodes, each marked with icons (settings, lock, briefcase, location, star, and additional symbols) and numbered 01-06. Second slide presents the same diagram structure in purple tones, offering color variation options for different presentation contexts.
Related Products
-

Visualizing Strategic Goals with Key Success Factors Connection Diagram
#Product/Service Introduction #Business Vision and Strategy #Diagram
-

Core Competency Linkage Diagram – Essential Tool for Business Strategy
#Product/Service Introduction #Business Vision and Strategy #Diagram
-

Critical Success Factors Analysis Square Diagram
#Product/Service Introduction #Business Vision and Strategy #Diagram
-

KSF Circular Diagram – Visualizing Key Success Factors
#Product/Service Introduction #Business Vision and Strategy #Diagram
