Visualizing Strategic Goals with Key Success Factors Connection Diagram
RM0400008_16
- Last Update 02/16/2025
- File Size 0.3MB
- # of Slides 2
- File Format PPTX
- Slide Ratio 16:9
- Color
Keywords
- #Content-Based Slides
- #Design-Based Slides
- #Product/Service Introduction
- #Business Vision and Strategy
- #Diagram
- #Composition
- #Core Competencies
- #Cluster
- #Chain Diagram
- #16:9
- #connection diagram PowerPoint
- #key success factors slide
- #4-stage diagram template
- #business strategy visualization
- #cause-and-effect diagram PPT
About the Product
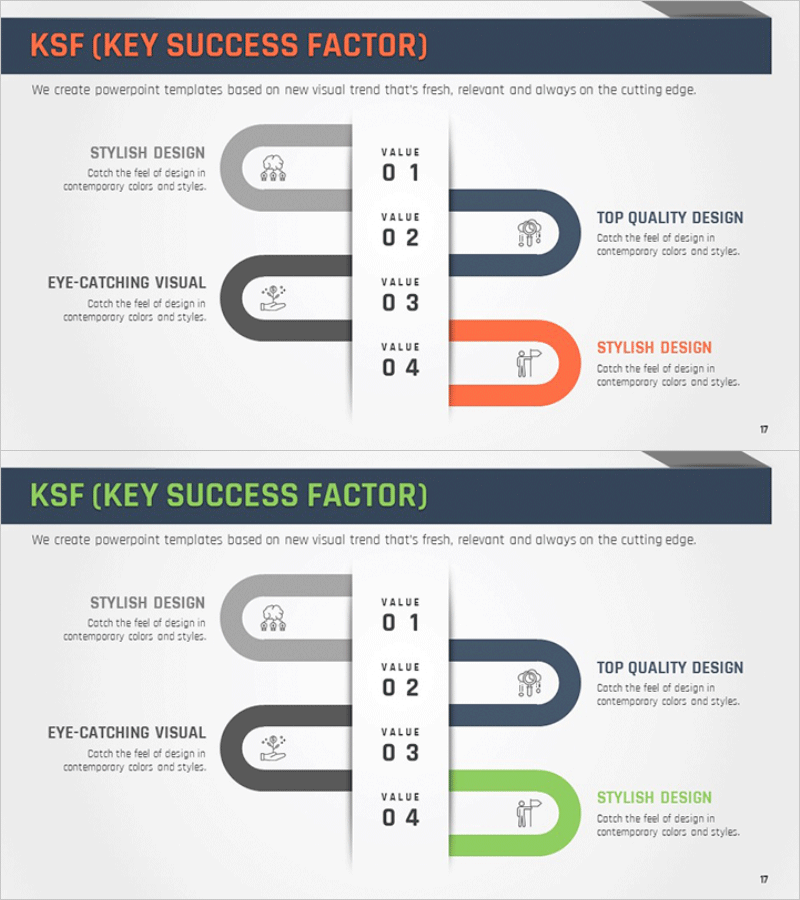
A PowerPoint slide that visualizes strategic goal achievement through a 4-stage connection diagram linking key success factors. The diagram flows from left input areas (Stylish Design, Eye-Catching Visual) to right outcome areas (Top Quality Design, Stylish Design), clearly expressing cause-and-effect relationships and process flows. Three accent colors—navy, orange, and green—distinguish priority levels, while the 16:9 ratio 2-slide set is ready for immediate presentation use.
Usage Points
-
Main Usage
Clearly communicate the interconnected relationships between key success factors in business strategy presentations and execution planning. The flow from left input elements to right outcome elements enables audiences to grasp cause-and-effect dynamics at a glance, making it ideal for presentations to executives, team members, and investors.
-
How to Use
Enter your organization's key success factors into each stage's text areas and use color highlighting to indicate priority levels. Insert into business strategy presentations, business plans, organizational capability analyses, and goal achievement roadmap slides to strengthen strategic messaging.
-
Recommended For
Executives, strategy planners, marketing professionals, consultants, and educators explaining business strategies, organizational improvements, and project success factors. Suitable for business plans, management reports, strategy planning meetings, and organizational capability enhancement training materials.
-
Slide Structure
2-slide set. Each slide features a 4-stage connection diagram divided into left input areas (2 items) and right outcome areas (2 items). Navy, orange, and green accent colors with connecting lines and icons express stage-by-stage relationships, optimized for large-screen presentations in 16:9 widescreen format.
Related Products
-

Critical Success Factors Diagram - The Foundation of Business Strategy
#Product/Service Introduction #Business Vision and Strategy #Diagram
-

KSF Circular Diagram – Visualizing Key Success Factors
#Product/Service Introduction #Business Vision and Strategy #Diagram
-

Business Growth Key Factors Diagram
#Product/Service Introduction #Business Vision and Strategy #Diagram
-

Service Core Function Connection Diagram – Vision and Strategy
#Product/Service Introduction #Business Vision and Strategy #Diagram
