KSF Circular Diagram – Visualizing Key Success Factors
RM0400001_16
- Last Update 02/14/2025
- File Size 0.4MB
- # of Slides 2
- File Format PPTX
- Slide Ratio 16:9
- Color
Keywords
- #Content-Based Slides
- #Design-Based Slides
- #Product/Service Introduction
- #Business Vision and Strategy
- #Diagram
- #Composition
- #Core Competencies
- #Cluster
- #Spread
- #Chain Diagram
- #Decentralized Diagram
- #16:9
- #circular diagram PowerPoint
- #6-node cycle diagram
- #KSF PowerPoint slide
- #key success factors visualization
- #diagram PowerPoint slide template
About the Product
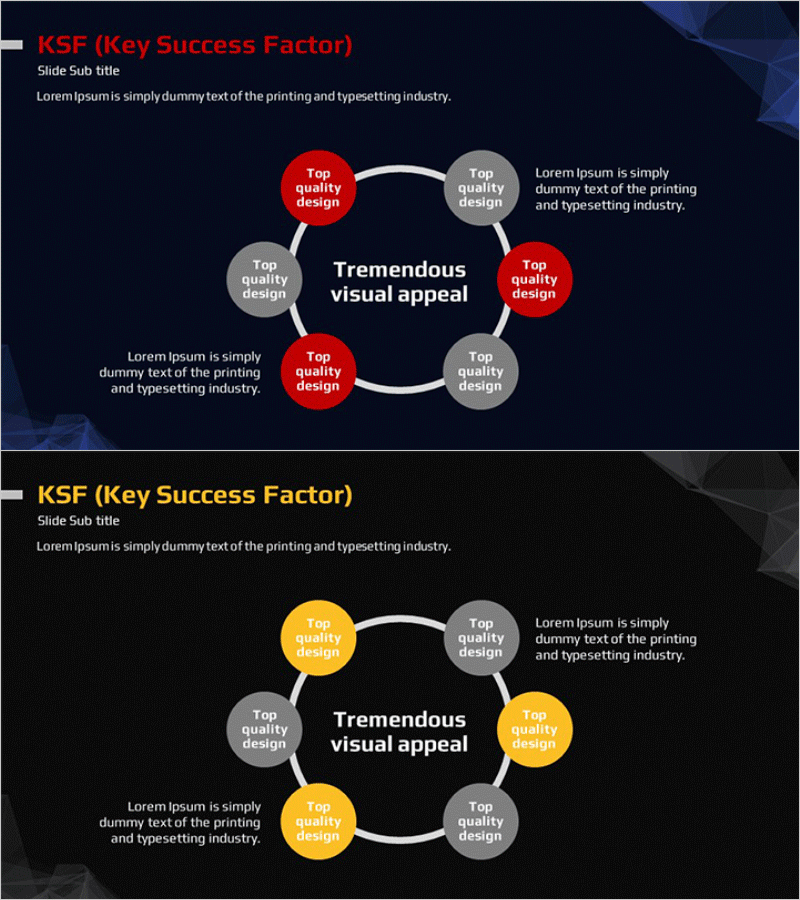
A circular diagram PowerPoint slide with 6 nodes arranged around a central focal point, using red and gray color coding to distinguish primary and secondary elements. White connecting lines create a clear cyclical relationship between interconnected factors. Ideal for visualizing KSF (Key Success Factors), business strategy components, and organizational capabilities. The 2-slide set includes a red-and-gray version and a yellow-and-gray variant, allowing you to match your presentation theme. Fully editable PPTX format with customizable text fields in each node.
Usage Points
-
Main Usage
Visualize Key Success Factors (KSF) analysis, business strategy frameworks, organizational capability mapping, and interdependent relationships. The circular arrangement emphasizes how multiple strategic elements interact and reinforce each other in a continuous cycle.
-
How to Use
Use in business plans, strategy reports, executive presentations, and organizational improvement proposals to explain how success factors interconnect. Assign primary factors to red nodes and supporting factors to gray nodes to create visual hierarchy and guide audience focus.
-
Recommended For
Executives, strategy managers, organizational development professionals, management consultants, and marketing strategists presenting business strategy, competitive advantage, or organizational transformation. Particularly effective when explaining multi-factor success models with interdependencies.
-
Slide Structure
Central text box surrounded by 6 circular nodes (approximately 80px diameter) evenly distributed in a ring formation. Nodes are connected by white curved lines forming a complete cycle. Each node accepts editable text, with red and gray color differentiation. Additional text areas on left and right sides provide space for supplementary explanations.
Related Products
-

KSF Critical Success Factors Circular Diagram
#Product/Service Introduction #Business Vision and Strategy #Diagram
-

Finger Puzzle Diagram – Product and Service Introduction
#Product/Service Introduction #Business Vision and Strategy #Diagram
-

Critical Success Factors Analysis Square Diagram
#Product/Service Introduction #Business Vision and Strategy #Diagram
-

Diffusion Strategy in Origami Design – Business Vision and Effective Connection
#Business Vision and Strategy #Diagram #Business Strategy
