Critical Success Factors Analysis Square Diagram
RM0400003_16
- Last Update 02/14/2025
- File Size 3.6MB
- # of Slides 2
- File Format PPTX
- Slide Ratio 16:9
- Color
Keywords
- #Content-Based Slides
- #Design-Based Slides
- #Product/Service Introduction
- #Business Vision and Strategy
- #Diagram
- #Composition
- #Core Competencies
- #Cluster
- #Chain Diagram
- #16:9
- #critical success factors diagram
- #KSF analysis PowerPoint
- #square diagram slide
- #connected flow diagram
- #strategic analysis presentation template
- #how to create KSF diagram in PowerPoint
About the Product
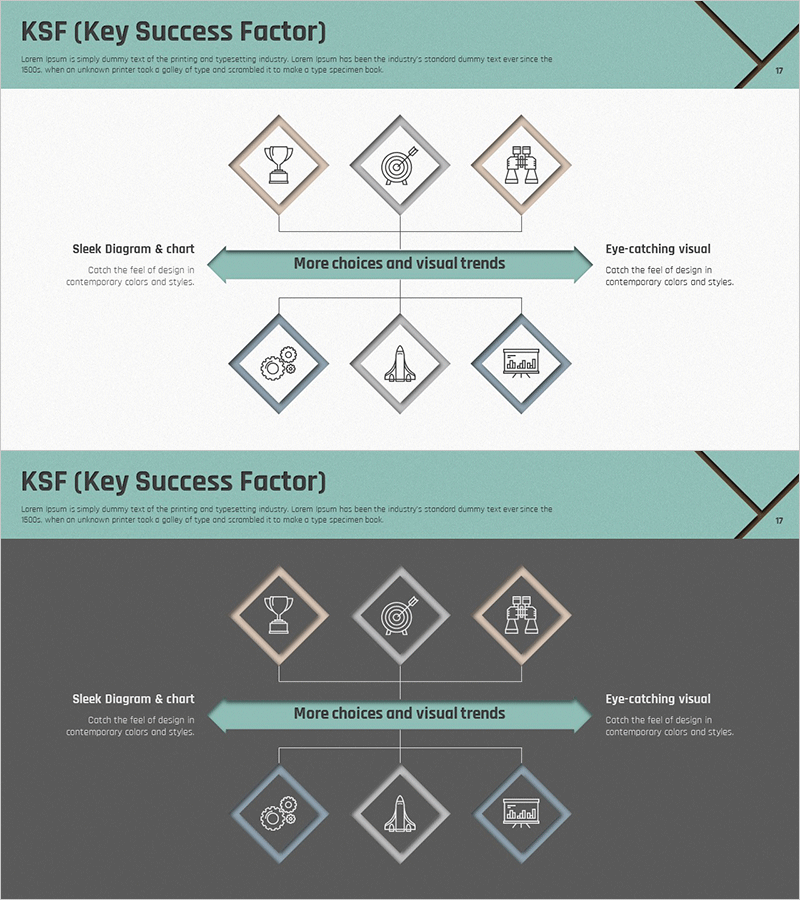
A PowerPoint slide featuring a 6-node square diagram for Critical Success Factors (KSF) analysis. The layout connects three upper nodes to three lower nodes through a central bidirectional arrow, visualizing the flow from 'Sleek Diagram & Chart' on the left to 'Eye-catching Visual' on the right. Diamond-framed nodes in gray, beige, and terracotta tones with integrated icons strengthen credibility for strategic presentations. The 2-slide set includes both light and dark background versions, fully editable in PPTX format for immediate customization.
Usage Points
-
Main Usage
Systematically analyze and communicate critical success factors during strategic planning and business development phases. The left-to-right causal relationship clearly illustrates how key elements drive desired outcomes, making abstract strategy concepts tangible for stakeholders.
-
How to Use
Input critical success factor items into the three upper and three lower nodes, then add connecting logic or process descriptions in the central arrow area. Customize icons by category and adjust colors to match corporate branding. Deploy in executive presentations, investor pitches, and strategic planning meetings.
-
Recommended For
Strategic planners, C-suite executives, management consultants, MBA students, and business development professionals analyzing competitive advantages, market entry conditions, and organizational capabilities. Ideal for business model validation, new venture planning, and organizational assessment presentations.
-
Slide Structure
2-slide set. Slide 1: Light background (light gray, white) with 6 square diagram nodes (3 upper, 3 lower) and central bidirectional arrow. Slide 2: Identical structure on dark background (charcoal gray, navy tones). Each node includes icon placeholder and text input area for customization.
Related Products
-

KSF Circular Diagram – Visualizing Key Success Factors
#Product/Service Introduction #Business Vision and Strategy #Diagram
-

Service Core Function Connection Diagram – Vision and Strategy
#Product/Service Introduction #Business Vision and Strategy #Diagram
-

Critical Success Factors Diagram - The Foundation of Business Strategy
#Product/Service Introduction #Business Vision and Strategy #Diagram
-

Core Competency Linkage Diagram – Essential Tool for Business Strategy
#Product/Service Introduction #Business Vision and Strategy #Diagram
