Expected Effect Overlay Diagram – Effective Business Strategy
RM0700001_15
- Last Update 02/25/2025
- File Size 2.1MB
- # of Slides 2
- File Format PPTX
- Slide Ratio 16:9
- Color
Keywords
- #Content-Based Slides
- #Design-Based Slides
- #Business Vision and Strategy
- #Business Strategy
- #Diagram
- #Business Vision
- #Financial Outlook & Expected Impact
- #Cluster
- #Combination Diagram
- #16:9
- #overlay diagram PowerPoint
- #business impact slide template
- #4-node cluster diagram
- #expected effects visualization
- #how to create overlay diagram in PowerPoint
About the Product
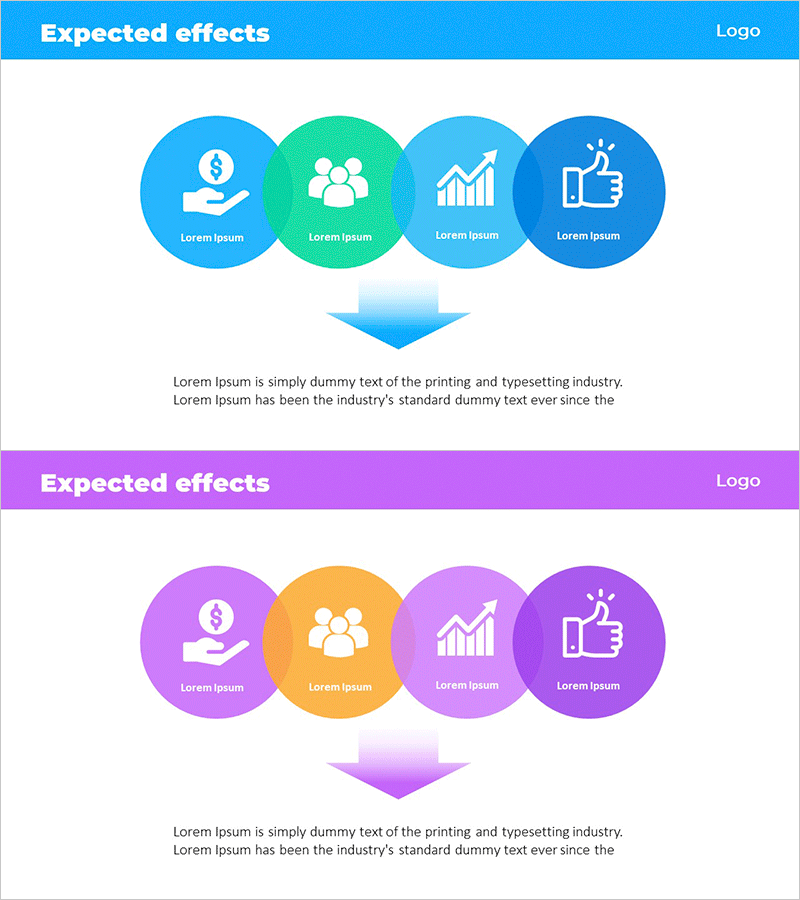
A four-node overlay diagram PowerPoint slide that visualizes business strategy expected effects through overlapping circular icons. The design features blue, green, light blue, and navy gradient backgrounds with layered circular nodes representing multiple dimensions such as revenue, workforce, growth, and satisfaction. A central arrow and descriptive text area below emphasize the conclusion across two slides. This presentation template is ready to use in vision, strategy, and implementation plan sections of business proposals and pitch decks.
Usage Points
-
Main Usage
Communicate anticipated business outcomes by categorizing four key dimensions—revenue, workforce, growth, and satisfaction—into overlapping circular nodes. The layered structure visually demonstrates the interconnection and integrated value of each effect, enhancing audience comprehension.
-
How to Use
Insert this slide into business plans, investment pitch decks, or strategy presentations in the expected effects section. Customize the text and icons in each circular node to match your business context, and populate the bottom description area with specific metrics or supporting evidence to strengthen credibility.
-
Recommended For
Executives, business planners, marketing managers, and investment professionals presenting business outcomes. Ideal for new business proposals, organizational restructuring explanations, and strategic meeting materials where multi-dimensional effects must be grasped at a glance.
-
Slide Structure
Slide 1: Header (blue background + title) + four overlapping circular nodes (each with icon and text) + central arrow. Slide 2: Identical header + purple, orange, and pink gradient version + four circular nodes + arrow. Both slides include descriptive text area at the bottom for customization.
Related Products
-

Projected Impact of Implementing AI in Life Science Solution
#Business Vision and Strategy #Business Strategy #Diagram
-

Global Business PowerPoint Template – Key Clusters for Project Progress
#Business Vision and Strategy #Business Strategy #Operational Plan
-

Construction Project Objectives Overlapping Diagram – Business Vision and Strategy
#Business Vision and Strategy #Operational Plan #Diagram
-

Strategy and Vision Square Diagram – Enhancing Business Strategy
#Business Vision and Strategy #Diagram #Business Vision
