Construction Project Objectives Overlapping Diagram – Business Vision and Strategy
RJ0900008_18
- Last Update 08/18/2025
- File Size 9.3MB
- # of Slides 2
- File Format PPTX
- Slide Ratio 16:9
- Color
Keywords
- #Content-Based Slides
- #Design-Based Slides
- #Business Vision and Strategy
- #Operational Plan
- #Diagram
- #Text Box
- #Business Vision
- #Business Goals
- #Organizational Structure and Staffing Plan
- #Cluster
- #Combination Diagram
- #16:9
- #overlapping diagram PowerPoint
- #three-circle Venn diagram
- #construction project objectives slide
- #business vision strategy diagram
- #overlapping diagram slide template
About the Product
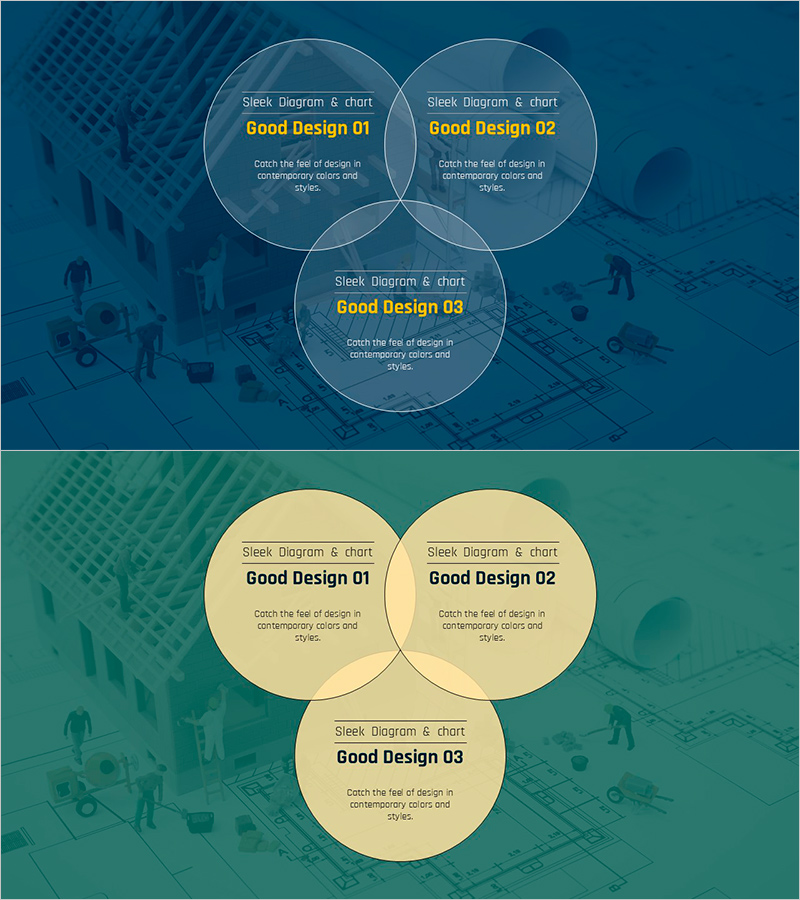
A three-circle overlapping diagram PowerPoint slide that visualizes construction project objectives, vision, and strategy through intersecting circular nodes. The design features transparent circles on a dark blue background, with overlapping areas highlighting the relationship between business goals and strategic initiatives. Provided in 2-slide format with dual color schemes (dark blue and cream), optimized for 16:9 widescreen presentations. Ideal for construction and architecture firms presenting business plans, strategy sessions, and investor pitches to clearly communicate core concepts and strategic alignment.
Usage Points
-
Main Usage
Visualizes the interconnected relationships between construction project objectives, vision, and strategy using a three-circle overlapping structure. The intersection areas emphasize core values and strategic execution alignment, enabling clear communication of business direction to stakeholders.
-
How to Use
Use in business plan presentations, strategy development meetings, investor pitch decks, and executive briefing materials. Input text into each circular area to define organizational objectives, vision, and strategy, then place key messages in intersection zones to enhance audience comprehension and engagement.
-
Recommended For
Ideal for construction and architecture company executives, project managers, business planning teams, and marketing professionals presenting strategic initiatives. Also valuable for consulting firms and financial institutions using strategy frameworks in investment review presentations and corporate communications.
-
Slide Structure
Three circular nodes arranged in overlapping Venn diagram format: two circles positioned at top-left and top-right, one at bottom-center, creating intersection areas. Each circle contains title and descriptive text input zones. Two color versions (dark blue and cream) provided for flexible presentation adaptation.
Related Products
-

Global Business PowerPoint Template – Key Clusters for Project Progress
#Business Vision and Strategy #Business Strategy #Operational Plan
-

Yellow Green Circular Diagram – Business Vision and Strategy
#Business Vision and Strategy #Operational Plan #Diagram
-

Keyword Strategy Diagram – Spreading Towards Business Goals
#Business Vision and Strategy #Operational Plan #Diagram
-

Hexagonal Nesting Diagram for Visualizing Business Vision – Strategic Goal Setting
#Business Vision and Strategy #Diagram #Business Vision
