Projected Impact of Implementing AI in Life Science Solution
RJ0700033_5
- Last Update 07/30/2025
- File Size 1.9MB
- # of Slides 2
- File Format PPTX
- Slide Ratio 16:9
- Color
Keywords
- #Content-Based Slides
- #Design-Based Slides
- #Business Vision and Strategy
- #Business Strategy
- #Diagram
- #Business Vision
- #Financial Outlook & Expected Impact
- #Cluster
- #Combination Diagram
- #16:9
- #overlapping diagram PowerPoint
- #circular diagram slide template
- #3-stage process visualization
- #AI solution impact slide
- #life science business diagram PowerPoint
About the Product
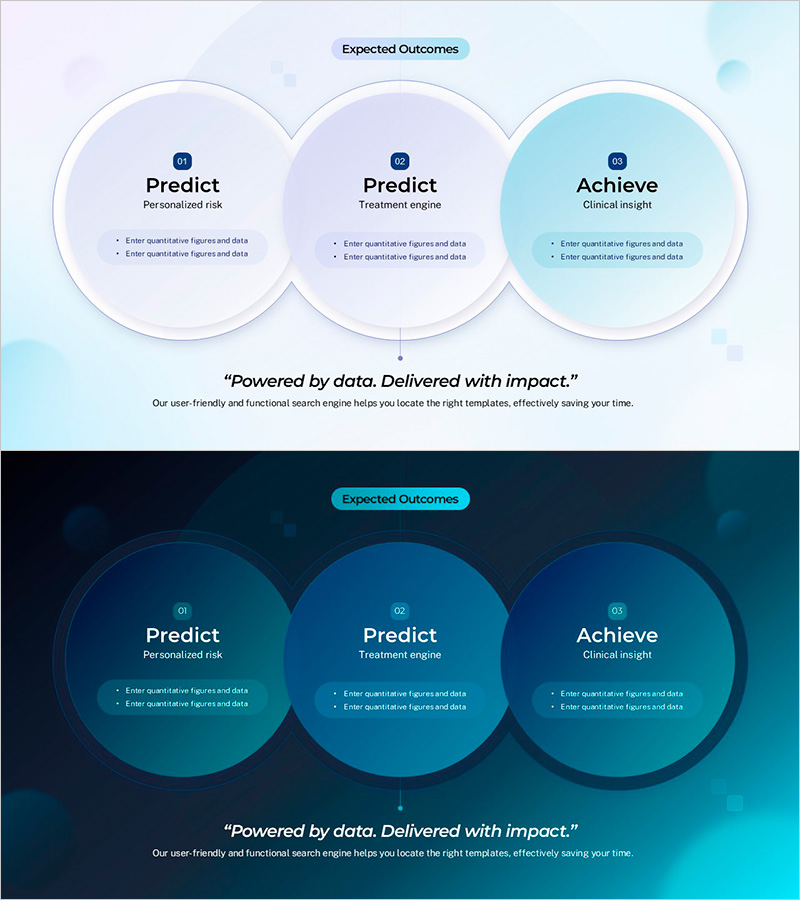
A PowerPoint slide featuring a 3-stage overlapping circular diagram that visualizes the expected outcomes of implementing AI life science solutions. The design uses a soft lavender-to-cyan gradient background with three white-bordered circular nodes arranged in an overlapping pattern from left to right. Each node contains space for stage titles, key messages, and supporting details. This slide is ideal for strategic presentations, business proposals, and investor pitches in healthcare, life sciences, and AI technology sectors. The 2-slide set includes both light and dark background versions to adapt to different presentation environments and display settings.
Usage Points
-
Main Usage
Clearly communicate the expected outcomes of AI life science solution implementation across three distinct stages to your audience. Input stage titles and key value propositions (risk prediction, treatment engine, clinical insight) in each circular node, then add supporting details to explain complex business value in a logical progression.
-
How to Use
Enter stage names, core messages, and supporting points into each circular node. Use the light background version for daytime presentations and printed materials; select the dark background version for evening presentations and large-screen displays. Adjust text size and color emphasis to highlight priority stages and key differentiators.
-
Recommended For
Ideal for executives, marketing teams, and sales professionals in healthcare, life sciences, and AI technology companies presenting to investors, clients, and partners. Perfect for business proposals, strategic presentations, investor relations materials, and product introduction decks where you need to communicate multi-stage solution benefits.
-
Slide Structure
Three white-bordered circular nodes overlap progressively from left to right on a lavender-to-cyan gradient background. Each circle contains labeled sections for stage number, title, and descriptive text. A unified message line anchors the bottom of the composition. Two color variants provided: light background for standard use and dark background for high-contrast environments.
Related Products
-

Expected Effect Overlay Diagram – Effective Business Strategy
#Business Vision and Strategy #Business Strategy #Diagram
-

Global Business PowerPoint Template – Key Clusters for Project Progress
#Business Vision and Strategy #Business Strategy #Operational Plan
-

Overlapping Diagram of Core Business Vision
#Company Introduction #Business Vision and Strategy #Diagram
-

Strategy and Vision Square Diagram – Enhancing Business Strategy
#Business Vision and Strategy #Diagram #Business Vision
