Visualizing Market Analysis with Yearly Round Bar Graph
RJ0300046_17
- Last Update 04/30/2025
- File Size 3.4MB
- # of Slides 2
- File Format PPTX
- Slide Ratio 16:9
- Color
Keywords
- #Content-Based Slides
- #Design-Based Slides
- #Market and Competitor Analysis
- #Graph
- #Market Analysis
- #Industry Trends
- #Column
- #Column Chart
- #16:9
- #clustered column chart PowerPoint
- #year-over-year comparison slide
- #market analysis template
- #dual data series visualization
- #bar chart download
- #competitive analysis PowerPoint
About the Product
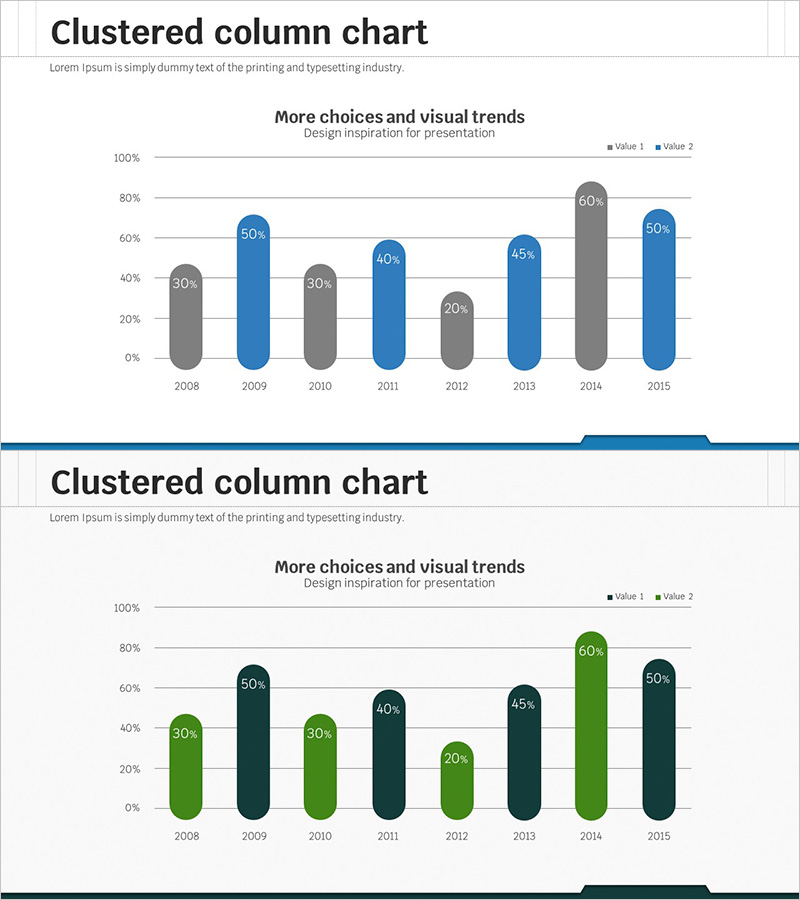
A clustered column chart PowerPoint slide designed for visualizing market analysis data across multiple years. This presentation template displays 8 years of data (2008–2015) with two distinct data series (Value 1 and Value 2) positioned side-by-side for direct comparison. The gray and blue color scheme clearly differentiates the two series, while percentage values displayed above each column ensure precise data interpretation. The 16:9 widescreen format includes 2 fully editable slides ready for immediate use in business presentations, reports, and competitive analysis decks.
Usage Points
-
Main Usage
Ideal for comparing two data series across multiple years—such as market share, revenue trends, or competitor performance. The clustered layout enables viewers to instantly grasp year-to-year differences within each series while observing long-term patterns across the entire timeline.
-
How to Use
Insert this slide into business reports, marketing presentations, investor pitch decks, or quarterly performance reviews. Simply replace the sample data with your own figures, update the legend labels and title, and the slide is ready for presentation. All chart elements are fully editable.
-
Recommended For
Marketing managers, business analysts, executives, and consultants presenting performance metrics, market trends, or departmental comparisons. Particularly effective when demonstrating side-by-side performance of two products, regions, or business units over an extended period.
-
Slide Structure
Slide 1: Title area + 8-year clustered columns (2008–2015) with dual series + legend (Value 1, Value 2) + percentage labels. Slide 2: Identical layout with alternative color scheme (gray and green). Both slides feature editable shapes, text boxes, and data labels in 16:9 format.
Related Products
-

Market Trend Analysis Bar Graph & Table
#Market and Competitor Analysis #Diagram #Graph
-

Mobile Market Analysis Bar & Line Charts – Trend Visualization
#Market and Competitor Analysis #Graph #Market Analysis
-

Modern Theme Bar Graph – Optimized Design for Market Analysis
#Market and Competitor Analysis #Graph #Market Analysis
-

Vertical Bar PC Mockup Graph – Market and Competitive Analysis
#Market and Competitor Analysis #Graph #Other
