Market Outlook Donut Chart – Vision for the Future
RM0700001_13
- Last Update 02/25/2025
- File Size 2.7MB
- # of Slides 2
- File Format PPTX
- Slide Ratio 16:9
- Color
Keywords
About the Product
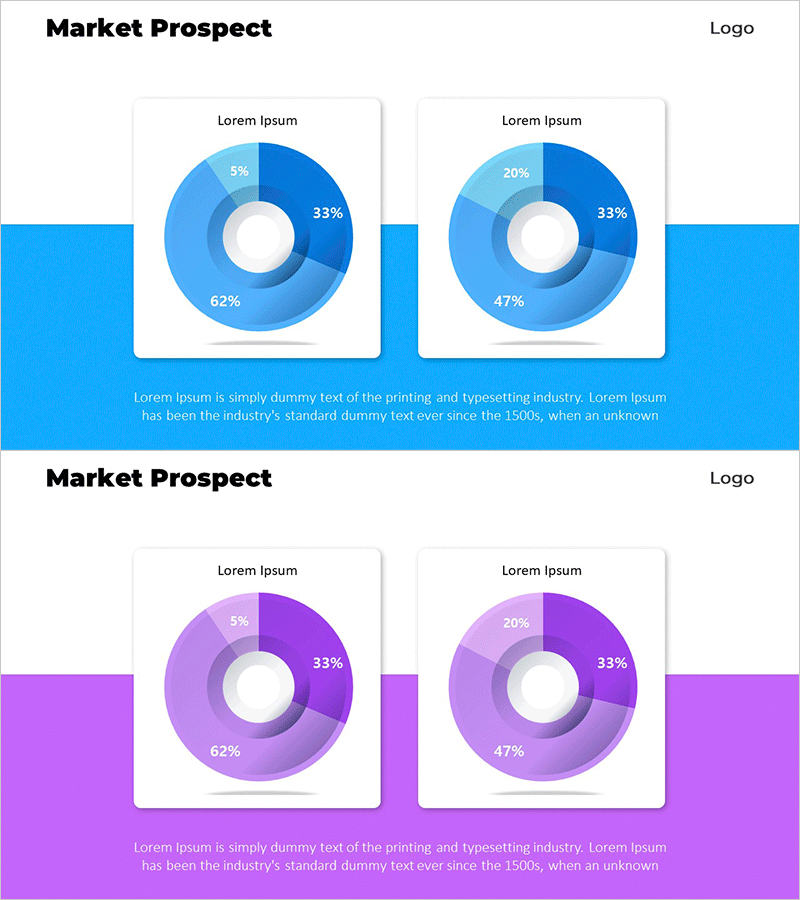
A two-slide PowerPoint presentation template featuring donut charts designed for market outlook and competitive analysis. The set includes blue and purple color variants, each with a four-segment donut chart that visually represents market share, customer composition, budget allocation, and percentage data. The hollow center area allows you to insert key metrics or category labels for enhanced data emphasis. Created in 16:9 widescreen format for compatibility with modern projectors and online presentations, this fully editable PPTX template enables quick customization and immediate use in business reports and strategic presentations.
Usage Points
-
Main Usage
Visualize proportional relationships such as market share, customer demographics, budget distribution, and sales percentages. The hollow center of the donut design accommodates key metrics or category names, amplifying data emphasis. This template is ideal for multi-series comparisons in management analysis and strategic business communications.
-
How to Use
Input data values into each of the four segments and update the legend text accordingly. Add key indicators or titles to the center circle area to maximize emphasis. Retain the existing blue and purple color schemes or customize them to match your corporate brand colors. Arrange both slides sequentially to illustrate trends and changes over time.
-
Recommended For
Executive reports, quarterly earnings presentations, market analysis documents, investor relations meetings, competitive analysis presentations, marketing strategy sessions, financial performance reviews, customer segmentation analysis, and all business presentations requiring proportion-based data visualization.
-
Slide Structure
Two-slide layout. Each slide features a four-segment donut chart positioned centrally, with a title area at the top and descriptive text space at the bottom. Slide one displays a blue color palette (5%, 33%, 62%, 20% segments), while slide two presents a purple palette with identical segment proportions, enabling side-by-side comparison and contrast visualization.
Related Products
-

Market Integration Analysis Graph – Future Projections
#Market and Competitor Analysis #Graph #Other
-

Donut Chart Comparing Market Share by Coffee Brand
#Market and Competitor Analysis #Diagram #Graph
-

Global Business PowerPoint Template Wide Donut Chart
#Market and Competitor Analysis #Graph #Customer Analysis
-

Triangular Pattern Presentation Template for Doughnut Chart
#Market and Competitor Analysis #Marketing Plan and Strategy #Graph
