Stock Distribution and Market Analysis Table Slide
RM0600004_7
- Last Update 02/24/2025
- File Size 1.6MB
- # of Slides 2
- File Format PPTX
- Slide Ratio 16:9
- Color
Keywords
- #Content-Based Slides
- #Design-Based Slides
- #Financial Plans and Performance
- #Diagram
- #Capital Requirements
- #Projected Return on Investment (ROI)
- #Table
- #16:9
- #stock distribution PowerPoint slide
- #market analysis table slide
- #financial data table PPT
- #investment return rate presentation
- #capital requirement planning slide
About the Product
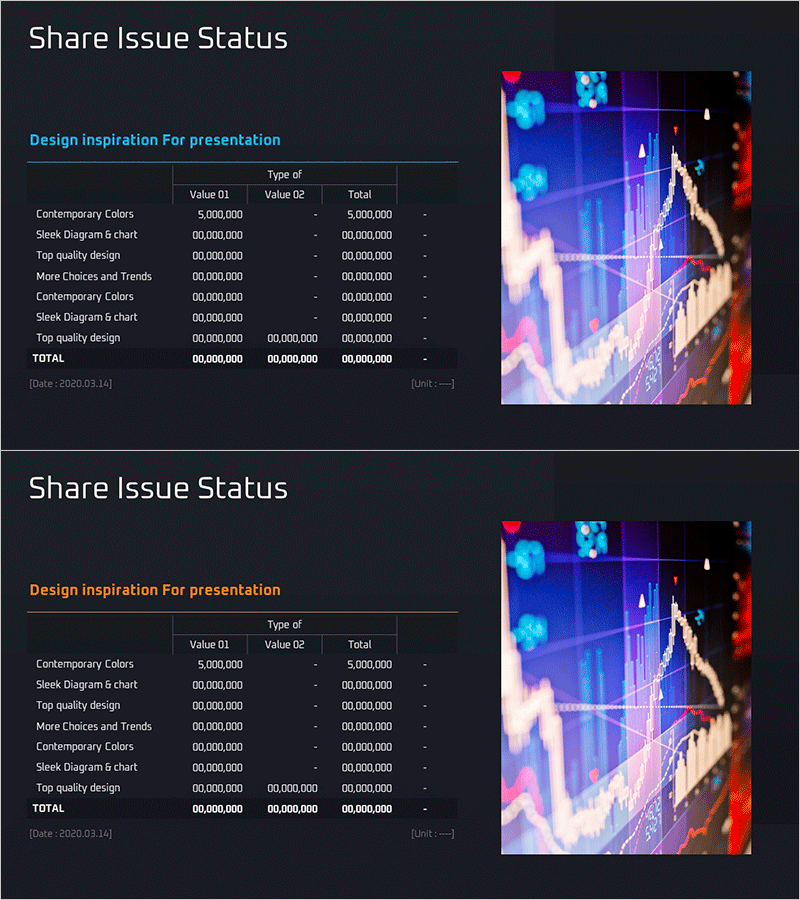
A 2-slide PowerPoint presentation featuring stock distribution and market analysis data in table format. The dark background design incorporates cyan, pink, and orange accent colors to highlight key financial metrics and investment information. Each slide follows a Value 01, Value 02, and Total column structure, making it ideal for investor presentations, IR materials, and business plan financial sections. Provided in 16:9 widescreen PPTX format with clearly defined text and data entry areas for easy updates and customization.
Usage Points
-
Main Usage
Present stock distribution status and market analysis data numerically in investor presentations, IR materials, and business plans. This slide ensures both credibility and readability of financial information while serving as a key data visualization tool for decision-making support.
-
How to Use
Enter stock distribution items (such as Contemporary Colors, Sleek Diagram, Top quality design) in each row, then input corresponding values in the Value 01 and Value 02 columns. The Total column can display auto-calculated sums or manual entries. Additional rows can be inserted for more items as needed. Colors and fonts can be maintained as-is or adjusted to match your company branding.
-
Recommended For
CFOs, financial managers, and investor relations professionals presenting stock distribution status and market analysis results to executives, investors, and partners. Suitable for business plans, investment pitch decks, quarterly financial reports, and market analysis presentations.
-
Slide Structure
2-slide layout with each slide containing a title area and one data table. The table features 8-10 rows × 4 columns (Item Name, Value 01, Value 02, Total) with a dark header row and light data rows to establish clear information hierarchy. The upper-right chart image area can be used for additional visualizations or company logo placement.
Related Products
-

Stock Structure and Issuance History Analysis Table – Efficient Data Visualization
#Financial Plans and Performance #Diagram #Capital Requirements
-

Curved Theme Purple Template Diagram – Investment Planning and Performance
#Financial Plans and Performance #Diagram #Capital Requirements
-

Stock Structure and Issuance History Analysis Table – Integrated Financial Data
#Financial Plans and Performance #Diagram #Capital Requirements
-

Stock Issuance Status Analysis Chart – Financial Planning and Performance
#Financial Plans and Performance #Diagram #Capital Requirements
