Visualizing Financial Status with Balance Sheet Table
RM0100019_31
- Last Update 01/31/2025
- File Size 0.9MB
- # of Slides 2
- File Format PPTX
- Slide Ratio 16:9
- Color
Keywords
About the Product
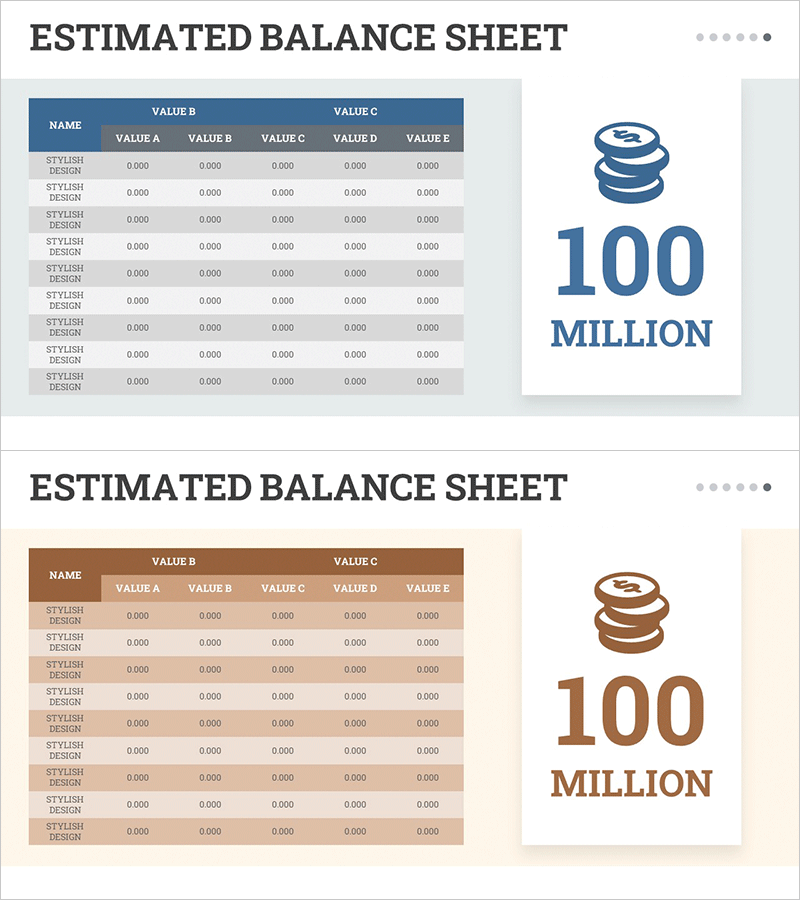
A professional balance sheet PowerPoint slide that visualizes financial status with clarity and precision. This 2-slide set features a dual-tone color scheme combining blue and brown, with a structured 5-column table (VALUE A through E) designed to display assets, liabilities, and equity items side by side for immediate comparison. Both slides maintain consistent table architecture while varying color palettes to ensure presentation cohesion. Delivered in 16:9 widescreen PPTX format with clearly defined data entry fields for seamless editing. Ideal for investor presentations, financial reports, executive briefings, and quarterly earnings disclosures where accurate financial data visualization is essential.
Usage Points
-
Main Usage
Presents assets, liabilities, and equity data in a structured tabular format that enables stakeholders to quickly assess financial position and compare key metrics. Delivers financial credibility through organized, data-driven presentation suitable for C-suite executives, investors, and regulatory audiences.
-
How to Use
Insert into the financial overview or results section of investor decks, annual reports, or quarterly earnings presentations. Populate each VALUE column with corresponding financial line items, leverage the dual-tone color scheme to distinguish data categories, and sequence both slides to emphasize comparative analysis and trend insights.
-
Recommended For
CFOs, financial controllers, investor relations managers, and corporate finance teams presenting to boards, investors, analysts, and stakeholders. Applicable to IPO roadshows, funding pitches, quarterly earnings calls, M&A presentations, and strategic financial planning sessions.
-
Slide Structure
Each slide contains a title area at the top and a structured table below with NAME column and five VALUE columns (A–E). The table includes 10 data entry rows with clear cell boundaries. Blue variant conveys stability and trust; brown variant emphasizes professionalism and analytical rigor, allowing flexible color selection based on presentation context.
Related Products
-

Organizing Insights for Clarity – Emphasizing Financial Planning and Performance
#Financial Plans and Performance #Diagram #Balance Sheet
-

Income Statement Table Chart – Overview of Financial Planning and Performance
#Financial Plans and Performance #Diagram #Balance Sheet
-

Yellow Green Income Statement Table – Efficient Financial Analysis
#Financial Plans and Performance #Diagram #Balance Sheet
-

Balance Sheet Slide – Harmonizing Financial Performance and Design
#Financial Plans and Performance #Diagram #Balance Sheet
