Diagram Table Slide for Financial Performance Analysis
RM0100016_31
- Last Update 01/30/2025
- File Size 0.3MB
- # of Slides 2
- File Format PPTX
- Slide Ratio 16:9
- Color
Keywords
About the Product
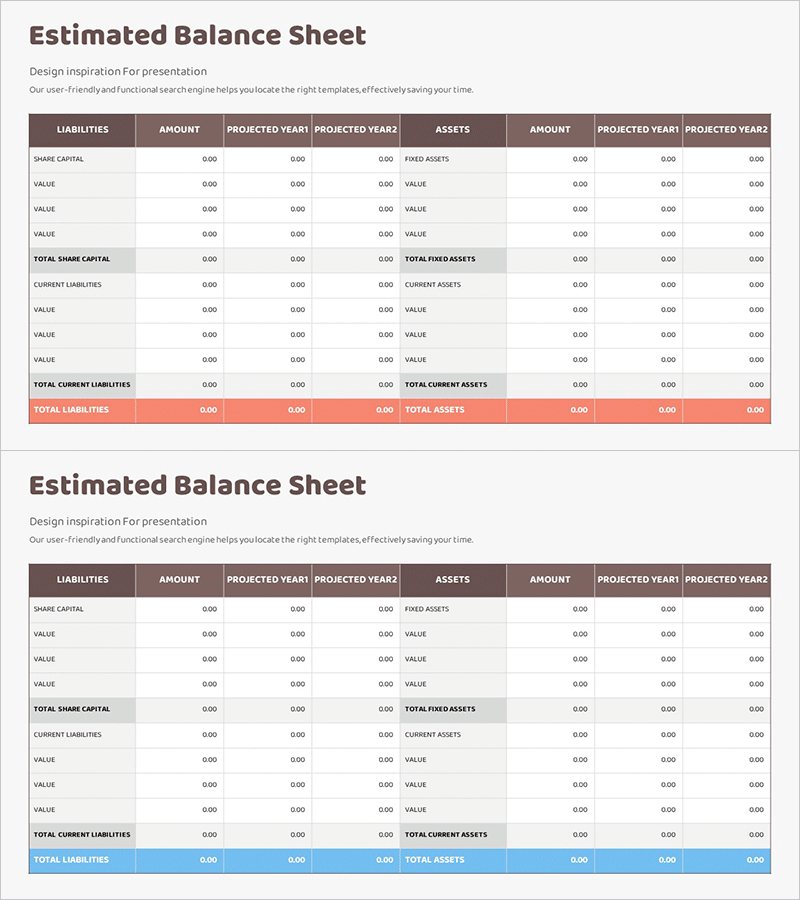
A professional balance sheet PowerPoint slide designed for financial performance analysis and forecasting. The layout features a symmetrical two-column structure with liabilities and equity on the left and assets on the right, enabling intuitive visualization of financial balance. The brown header and white background create clear contrast for data entry fields, while three-year comparison columns (current year, projected year 1, projected year 2) optimize the slide for financial trend analysis. This presentation slide is ready to use in investor pitches, IR materials, and financial planning documents.
Usage Points
-
Main Usage
This slide systematically visualizes financial performance analysis and forecast data. The symmetrical left-right structure of liabilities, equity, and assets enables stakeholders to grasp financial balance at a glance, while the three-year comparison (current, projected year 1, projected year 2) effectively communicates financial trends and growth potential.
-
How to Use
Use this slide in investor presentations (IR), financial planning documents, and business plans within the financial section. Simply input numerical values and the financial structure is automatically visualized. Year-over-year comparisons provide clear decision-making evidence. Ideal for presentations to banks, investment firms, and shareholders.
-
Recommended For
CFOs, financial managers, investment relations specialists, business planning teams, and financial institution officers. Particularly essential for startup investment pitches, quarterly and annual financial reporting, and financial feasibility sections in new business proposals.
-
Slide Structure
The two-slide set features a symmetrical layout with liabilities and equity on the left and assets on the right. Each section includes a row for item names and three columns for current year, projected year 1, and projected year 2 data entry. Brown headers clearly distinguish sections and establish information hierarchy for easy data input.
Related Products
-

Visualizing Financial Status with Balance Sheet Table
#Financial Plans and Performance #Diagram #Balance Sheet
-

Corporate Financial Evaluation Analysis Balance Sheet – Data Visualization
#Financial Plans and Performance #Diagram #Balance Sheet
-

Emphasizing Key Row in Table – Essential Tool for Financial Management
#Financial Plans and Performance #Diagram #Balance Sheet
-

Organizing Insights for Clarity – Emphasizing Financial Planning and Performance
#Financial Plans and Performance #Diagram #Balance Sheet
