Business Budget Summary Table – Visualizing Financial Plans and Performance
RM0500007_27
- Last Update 02/22/2025
- File Size 2.5MB
- # of Slides 2
- File Format PPTX
- Slide Ratio 16:9
- Color
Keywords
- #Content-Based Slides
- #Design-Based Slides
- #Financial Plans and Performance
- #Diagram
- #Projected Return on Investment (ROI)
- #Budget
- #Table
- #16:9
- #budget comparison table PowerPoint slide
- #financial data table presentation
- #business budget PPT design
- #how to create a budget table in PowerPoint
- #financial performance slide template
About the Product
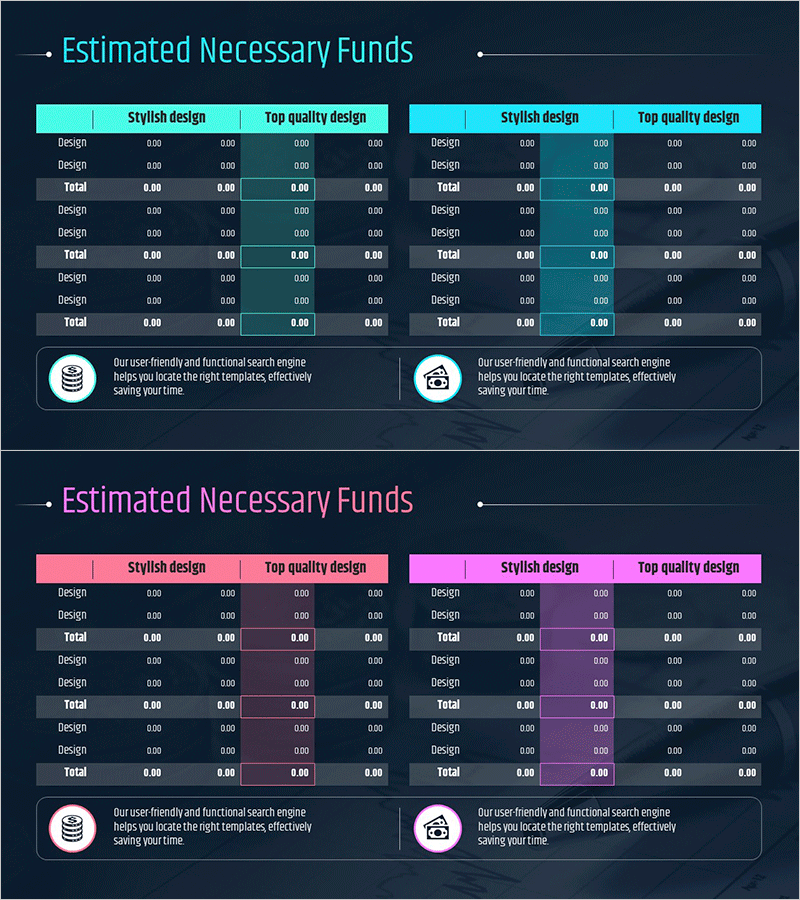
A 2-slide PowerPoint presentation designed to visualize business budget status and financial performance at a glance. Features a turquoise header with dark background contrast that enhances data readability and clarity. Includes two design versions: Stylish Design and Top Quality Design, both optimized for financial reporting and investment presentations. The table structure accommodates budget items, revenue figures, and performance metrics in a structured format. Delivered in 16:9 widescreen PPTX format compatible with all presentation platforms.
Usage Points
-
Main Usage
Presents business budget status, return on investment, budget allocation, and financial performance analysis through structured table visualization. The turquoise header and dark background contrast maximizes numerical data readability and conveys credibility to investors and executives during financial presentations.
-
How to Use
Input budget items, amounts, and percentages directly into the table cells on each slide. Select Stylish Design for internal meetings or Top Quality Design for external investor presentations. Colors and fonts are fully editable to match your corporate branding guidelines.
-
Recommended For
CFOs, financial managers, executives, and investment officers presenting business budgets, investor relations materials, financial analysis reports, and budget planning meetings. Ideal for startup fundraising pitches, quarterly earnings reports, and budget review sessions.
-
Slide Structure
2-slide deck with dual-column table layout on each slide. Turquoise header row displays 'Stylish Design' and 'Top Quality Design' column labels. Below are 4-5 data entry rows for budget line items, concluding with a Total row for summary calculations. Optimized for side-by-side financial data comparison and analysis.
Related Products
-

Potential and Plans for Attracting Additional Investment - Projected ROI and Strategic Budget Analysis
#Financial Plans and Performance #Diagram #Projected Return on Investment (ROI)
-

Estimated Fund Requirements for Real Estate Investment Slide – Foundation of Financial Planning
#Financial Plans and Performance #Diagram #Projected Return on Investment (ROI)
-

Medical Business Expected Funding Requirements Table – Efficient Financial Planning
#Financial Plans and Performance #Diagram #Projected Return on Investment (ROI)
-

Marketing Budget Analysis Table – Efficient Budget Allocation
#Financial Plans and Performance #Diagram #Projected Return on Investment (ROI)
