Marketing Budget Table Chart – Efficient Financial Planning
RM0400003_26
- Last Update 02/15/2025
- File Size 3.6MB
- # of Slides 2
- File Format PPTX
- Slide Ratio 16:9
- Color
Keywords
About the Product
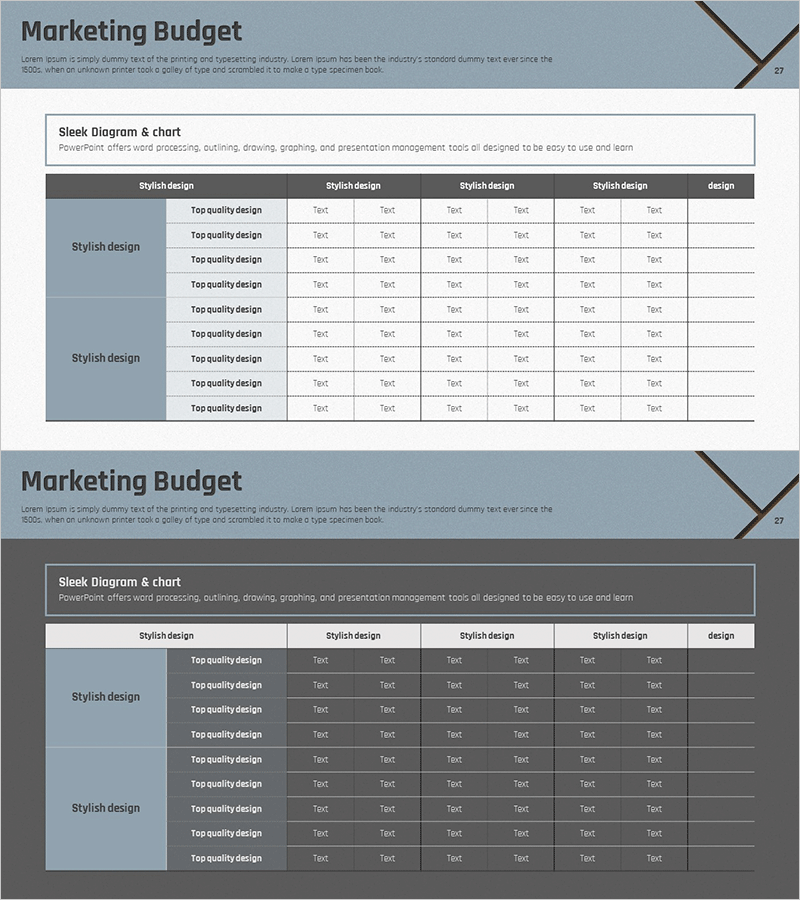
A 2-slide PowerPoint template designed for marketing budget planning and financial analysis. Featuring a blue-gray header with multi-row table structure, it enables clear comparison of budget items, ROI analysis, and departmental allocation at a glance. Easily input text and numerical data directly in PowerPoint. Ideal for the financial section of marketing plans, business proposals, and investment pitches. Provided in 16:9 widescreen format and fully editable PPTX compatible with all PowerPoint versions.
Usage Points
-
Main Usage
Visualizes marketing budget allocation, departmental investment planning, and financial data comparison. The table format allows simultaneous comparison of multiple budget items, making it effective for presenting decision-making evidence.
-
How to Use
Use in the marketing strategy section of business plans, financial planning portion of investment proposals, and quarterly budget review meetings. Input budget amounts, projected ROI, and execution timelines in each cell to present budget coordination materials to teams.
-
Recommended For
Marketing managers, financial analysts, business planners, and executives presenting budget plans and financial status. Particularly useful for multi-channel marketing budget allocation, advertising spend planning, and establishing performance measurement criteria.
-
Slide Structure
Two-slide layout with the first slide containing a title area and 5-6 row table, and the second slide providing an alternative comparison table structure. Each table features a left category column with multiple data columns on the right.
Related Products
-

Environmental Pollution Infographic Table Template
#Financial Plans and Performance #Diagram #Projected Return on Investment (ROI)
-

Potential and Plans for Attracting Additional Investment - Projected ROI and Strategic Budget Analysis
#Financial Plans and Performance #Diagram #Projected Return on Investment (ROI)
-

Marketing Budget Analysis Table – Optimized for Financial Performance
#Financial Plans and Performance #Diagram #Projected Return on Investment (ROI)
-

Estimated Fund Requirements for Real Estate Investment Slide – Foundation of Financial Planning
#Financial Plans and Performance #Diagram #Projected Return on Investment (ROI)
