Startup Funding Needs Analysis Chart
RM0500010_27
- Last Update 02/22/2025
- File Size 0.5MB
- # of Slides 2
- File Format PPTX
- Slide Ratio 16:9
- Color
Keywords
- #Content-Based Slides
- #Design-Based Slides
- #Financial Plans and Performance
- #Diagram
- #Projected Return on Investment (ROI)
- #Budget
- #Table
- #16:9
- #funding needs analysis PowerPoint
- #startup funding table slide
- #financial comparison PPT
- #investment scenario analysis slide
- #how to create funding needs chart in PowerPoint
About the Product
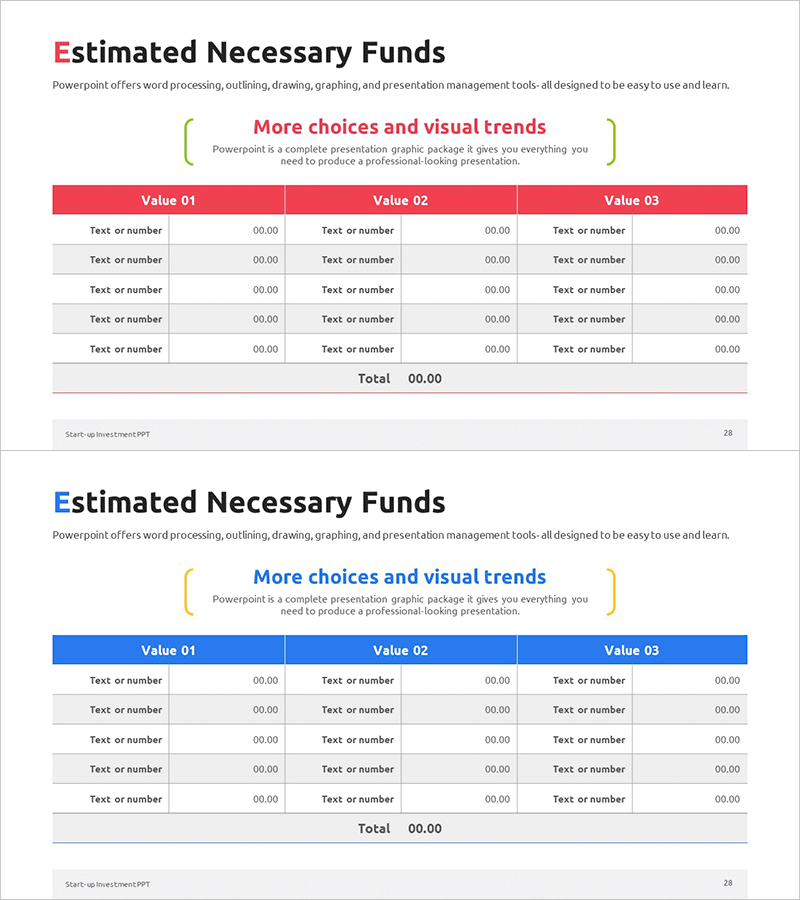
An essential PowerPoint slide for startup funding pitches and financial planning presentations. This slide features a 3-column comparison table layout with pink and blue header accents, designed for easy data entry and automatic total calculations. The 16:9 widescreen format with 2-slide set allows you to compare multiple funding scenarios at a glance. Ideal for investor presentations, business plans, and pitch decks that require clear financial visualization and professional data presentation.
Usage Points
-
Main Usage
Clearly present required funding amounts to investors and financial institutions for startups and new business ventures. Compare funding needs across three scenarios (conservative, baseline, aggressive) to strengthen decision-making credibility and demonstrate financial planning rigor.
-
How to Use
Enter fund category names and amounts into the table cells—totals calculate automatically. Use the pink, blue, and gray headers to distinguish between three funding scenarios, allowing you to showcase flexibility and multiple planning approaches in your capital requirements.
-
Recommended For
Startup founders and entrepreneurs presenting investment pitches, business plans, or loan applications to financial institutions. Also suitable for corporate business development teams explaining budget requirements in departmental planning meetings or board presentations.
-
Slide Structure
2-slide set with 5 fund category input rows plus total row on each slide. Three-color headers (pink, blue, gray) distinguish scenarios, with text input areas organized in 2-column format (category name + amount) for streamlined data entry and professional appearance.
Related Products
-

Expected Funding Needs Analysis Table – Strategic Investment Planning
#Financial Plans and Performance #Diagram #Projected Return on Investment (ROI)
-

Medical Business Expected Funding Requirements Table – Efficient Financial Planning
#Financial Plans and Performance #Diagram #Projected Return on Investment (ROI)
-

Estimated Fund Requirements for Construction Projects – Clear Financial Planning
#Financial Plans and Performance #Diagram #Projected Return on Investment (ROI)
-

Expected Investment Return Calculation Slide
#Financial Plans and Performance #Diagram #Projected Return on Investment (ROI)
