Competitor Analysis Table – Visualizing Market Advantage
RM0500008_13
- Last Update 08/30/2025
- File Size 0.4MB
- # of Slides 2
- File Format PPTX
- Slide Ratio 16:9
- Color
Keywords
- #Content-Based Slides
- #Design-Based Slides
- #Market and Competitor Analysis
- #Diagram
- #Competitor Analysis
- #Competitive Advantage
- #Table
- #16:9
- #competitor analysis table PowerPoint
- #competitive comparison slide
- #market analysis table presentation
- #how to create competitor analysis in PowerPoint
- #4-row comparison table deck
About the Product
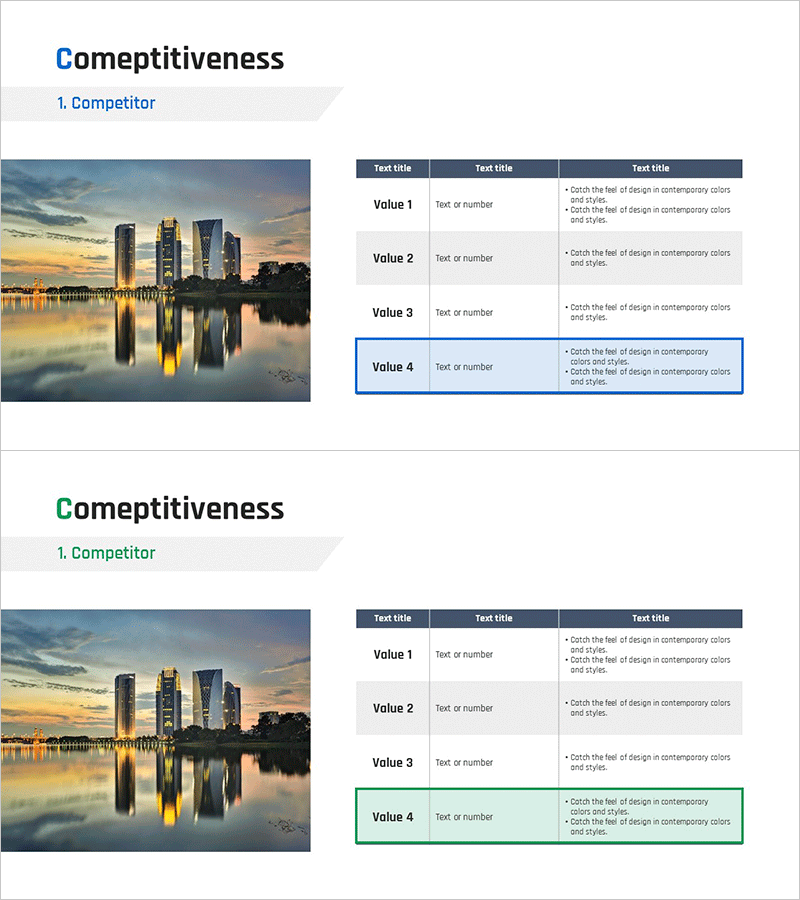
A 4-row comparison table PowerPoint slide designed for competitive analysis presentations. This slide combines a cityscape image on the left with a structured data table on the right, enabling side-by-side comparison of key metrics across competitors. The header features a dark navy background with white text, while data rows alternate between light gray and white for optimal readability. The final row is highlighted with a blue border to emphasize critical information. Two slide variations are included: the first with blue accent highlighting and the second with green accent highlighting, allowing flexibility based on presentation context. Provided in 16:9 widescreen PPTX format, fully editable in all PowerPoint versions.
Usage Points
-
Main Usage
This slide is optimized for systematically comparing key metrics across competitors and visually communicating your company's competitive advantage in the market. It is ideal for investor presentations, executive briefings, and strategic planning meetings where competitive landscape analysis needs to be clearly presented.
-
How to Use
Place a market-related or cityscape image in the left area, and populate the right table with competitor names and key performance indicators such as revenue, market share, technology capabilities, or customer satisfaction scores. Use the highlighted final row to emphasize your company's data or key conclusions.
-
Recommended For
Strategic planning teams, marketing professionals, business development managers, investor relations specialists, and executives presenting competitive analysis findings. Particularly effective for market assessment reports, competitive strategy development, and investor pitch decks.
-
Slide Structure
The first slide features a blue accent version with a cityscape image occupying approximately 40% of the width on the left and a 4-row table occupying 60% on the right. The table header contains 3 columns (Text title × 3), with each data row providing 3 input fields for values. The second slide offers an identical structure with green accent highlighting.
Related Products
-

Comparison Graph of Yearly Trends – Market and Competitor Analysis
#Market and Competitor Analysis #Diagram #Graph
-

Visualizing Market Trends with Musician Comparison Graphs
#Market and Competitor Analysis #Diagram #Graph
-

Eco-friendly Icon Bar Graph Slide
#Market and Competitor Analysis #Diagram #Graph
-

Visualizing Market Analysis with Line Chart – Harmony of Mint and Orange
#Market and Competitor Analysis #Diagram #Graph
