Business Profit Structure Layer Diagram – Visualization of Revenue Model
RM0500007_12
- Last Update 02/21/2025
- File Size 3.2MB
- # of Slides 2
- File Format PPTX
- Slide Ratio 16:9
- Color
Keywords
- #Content-Based Slides
- #Design-Based Slides
- #Product/Service Introduction
- #Business Introduction
- #Diagram
- #Graph
- #Development Status
- #Revenue Model
- #Structure
- #Cluster
- #Pyramid Chart
- #Chain Diagram
- #16:9
- #pyramid diagram PowerPoint
- #layered structure slide
- #business profit model visualization
- #revenue structure presentation
- #how to create pyramid diagram in PowerPoint
About the Product
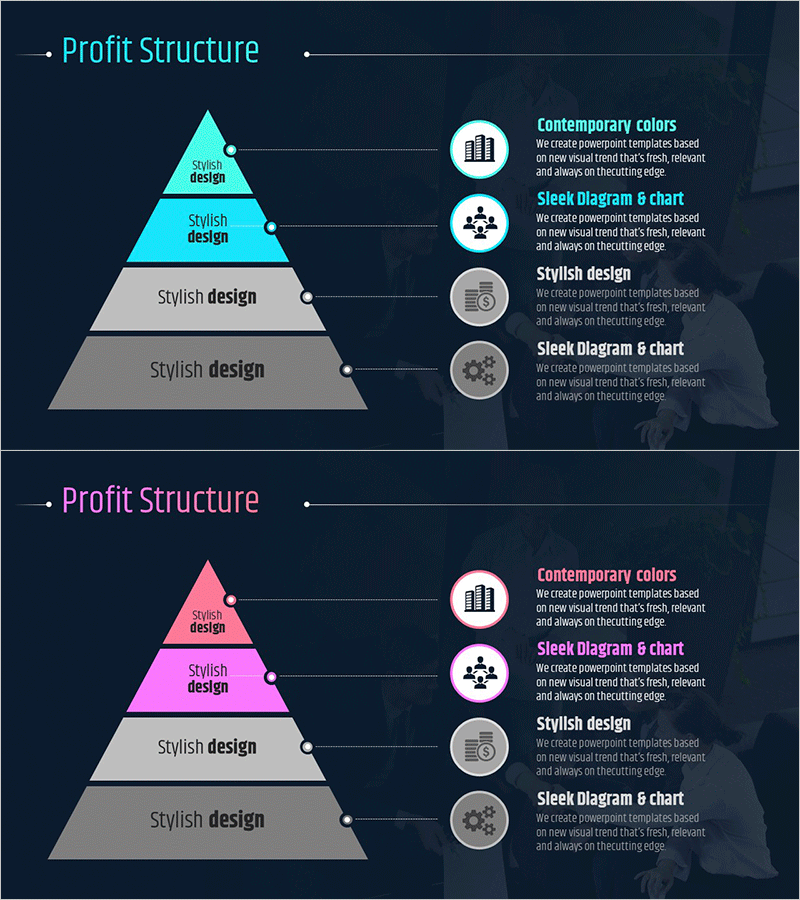
A PowerPoint slide that visualizes business profit structure and revenue model using a 4-layer pyramid diagram. Set against a dark navy background, each layer is distinguished by cyan, magenta, and gray tones to clearly represent the role of each tier. Circular icons and text descriptions on the right side detail each layer's function, while dotted connector lines intuitively express relationships between layers. This 2-slide presentation deck is ready for immediate use, with fully editable colors and text fields for customization.
Usage Points
-
Main Usage
Use this slide in business strategy presentations to explain profit generation structure and revenue flow by tier. It communicates each stage and role of your business model intuitively to executives, investors, and team members, transforming complex revenue structures into simple, clear visuals.
-
How to Use
Insert this slide into business plans, investor pitch decks, or management reports in the business model section. Customize each layer's text to match your business structure, and adjust colors to your brand palette before integrating into your presentation.
-
Recommended For
Ideal for startup founders, executives, business planners, marketing managers, and investor relations professionals presenting business strategy, investor meetings, and internal management reports. Particularly effective for explaining multi-tiered revenue models in platform, SaaS, and distribution businesses.
-
Slide Structure
Composed of a 4-layer pyramid diagram with color-coded tiers. Features a left-side pyramid with 4 layers, right-side circular icons (4 total), and dotted connector lines showing inter-layer relationships across 2 slides.
Related Products
-

Revenue Model and Cost Analysis Circle Graph
#Product/Service Introduction #Business Introduction #Diagram
-

Current Status of Financial Services System Slide – Data and Insights
#Product/Service Introduction #Business Vision and Strategy #Diagram
-

Vertical Bar Chart for Performance Visualization – Trust and Innovation
#Product/Service Introduction #Market and Competitor Analysis #Diagram
-

Medical Business Profit Structure Analysis Pie Chart
#Product/Service Introduction #Business Introduction #Diagram
