Medical Business Finance Management Plan – Efficiency and Systematization
RM0500006_28
- Last Update 02/21/2025
- File Size 1.8MB
- # of Slides 2
- File Format PPTX
- Slide Ratio 16:9
- Color
Keywords
- #Content-Based Slides
- #Design-Based Slides
- #Company Introduction
- #Financial Plans and Performance
- #Diagram
- #Business Areas
- #Capital Requirements
- #Table
- #16:9
- #funds management PowerPoint slide
- #financial data table presentation
- #budget planning slide
- #medical business finance PPT
- #funds management plan template
About the Product
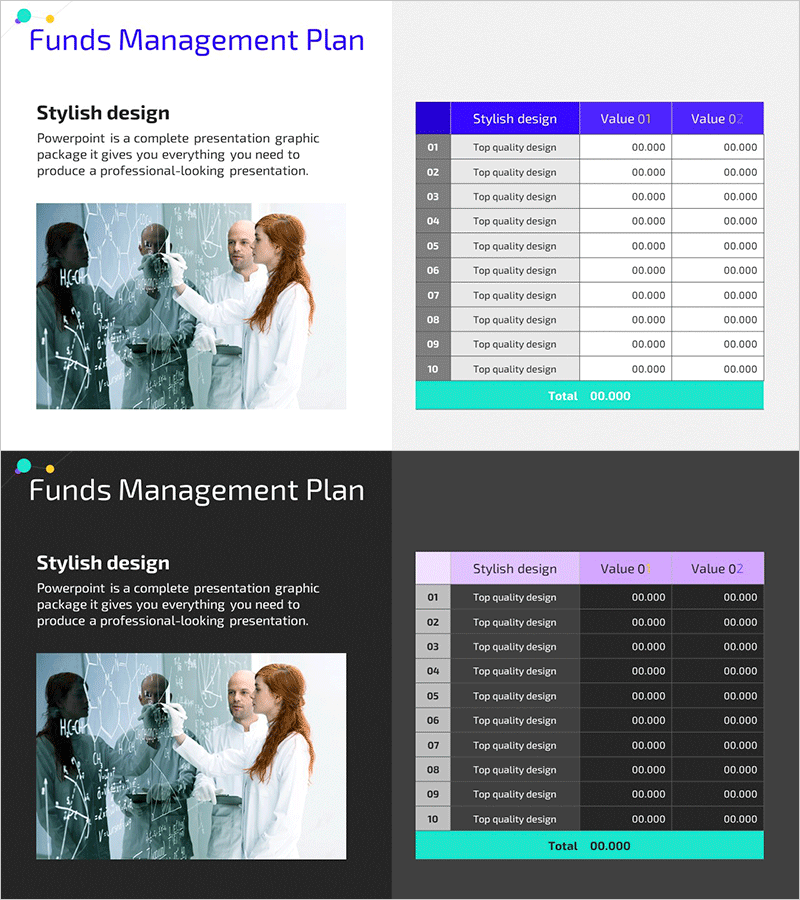
A financial data visualization PowerPoint slide designed for medical business and corporate funds management. This 2-slide deck features a left-side explanation area paired with a right-side 10-row financial table, supporting budget item input and automatic total calculation. The blue header and cyan footer create clear information hierarchy, making it immediately applicable for investor presentations, IR materials, and financial reports. Provided in 16:9 widescreen PPTX format with fully editable table cells for real financial data entry.
Usage Points
-
Main Usage
Visually communicate corporate and medical business funds management plans through structured financial data presentation. The table format enables investors, board members, and finance teams to grasp cash flow and budget allocation at a glance.
-
How to Use
Enter funds management strategy and objectives in the left text area, then input budget items (01–10) and corresponding values in the right table. Fill the blue header row with item names and gray data rows with amounts; the cyan footer automatically calculates the total.
-
Recommended For
CFOs, finance managers, medical institution executives, investment relations officers, and business plan authors benefit from this slide when presenting quantitative funds management status. Particularly valuable for IR materials, financial reports, and business plan presentations requiring credible data visualization.
-
Slide Structure
Two-slide deck with each slide divided into left explanation area (text + image space) and right financial table (10 rows × 3 columns: Item Name, Value 01, Value 02). Color-coded hierarchy: blue header, gray data rows, and cyan total row ensure clear information distinction.
Related Products
-

Annual Sales and Profit Table – Clearly Presenting Financial Plans
#Financial Plans and Performance #Diagram #Capital Requirements
-

Sales Revenue Analysis Table Chart – Efficiency and Reliability
#Operational Plan #Financial Plans and Performance #Diagram
-

Annual Income Statement Slide
#Financial Plans and Performance #Diagram #Capital Requirements
-

Table of Funding Plans by Year
#Financial Plans and Performance #Diagram #Capital Requirements
