Overseas Traveler Analysis Chart – Suitable for Budget Planning
RJ0600092_27
- Last Update 07/15/2025
- File Size 0.8MB
- # of Slides 2
- File Format PPTX
- Slide Ratio 16:9
- Color
Keywords
About the Product
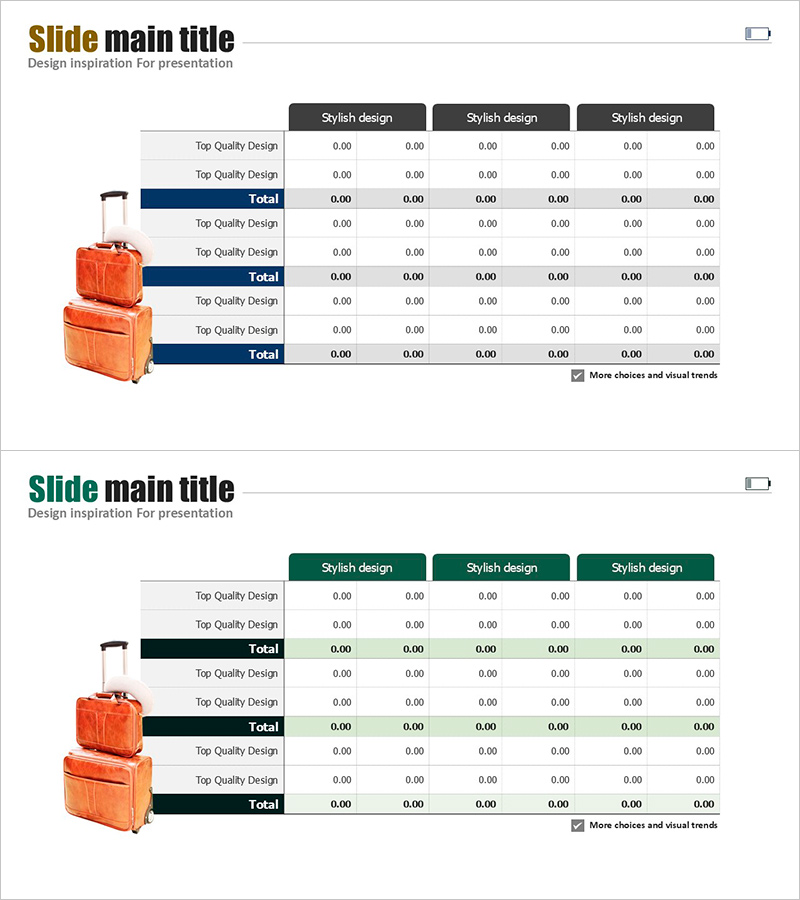
A horizontal bar table-style PowerPoint slide for visualizing overseas traveler analysis data. Featuring a consistent orange color palette, this slide template displays numerical data across six columns for easy comparison. Ideal for budget planning, cost analysis, and financial reporting presentations. The template includes 2 slides optimized for 16:9 widescreen format and is ready to use immediately in your PowerPoint deck.
Usage Points
-
Main Usage
This slide enables side-by-side comparison of multiple data points using horizontal bar table format. Ideal for displaying budget amounts, cost categories, regional figures, and other numerical comparisons in financial reports, marketing analysis, and business plan presentations.
-
How to Use
Simply input your data into each row and column of the table. The orange header and data cells are pre-formatted, so you only need to update the numbers and item names. The design maintains consistency while allowing flexibility for color and font adjustments if needed.
-
Recommended For
Finance teams, marketing departments, business planners, and consultants who need to present data-driven analysis. Particularly effective for budget planning, cost analysis, regional or departmental performance comparisons, and market research presentations.
-
Slide Structure
2-slide template featuring horizontal bar table format with 6 columns. Each slide includes row headers for item names and data cells with clear visual separation between the orange header row and white data area. Optimized for 16:9 widescreen presentation format.
Related Products
-

Estimated Budget Breakdown – Financial Planning and Budget Management
#Financial Plans and Performance #Diagram #Capital Requirements
-

Table Chart and Arrow Signs
#Financial Plans and Performance #Diagram #Capital Requirements
-

Create a Travel Budget – Strategic Planning
#Financial Plans and Performance #Diagram #Capital Requirements
-

Travel Budget and Expense Planning Slide
#Financial Plans and Performance #Diagram #Capital Requirements
