Blue Pink Sales and Profit Table
RM0100018_32
- Last Update 01/31/2025
- File Size 0.3MB
- # of Slides 2
- File Format PPTX
- Slide Ratio 16:9
- Color
Keywords
About the Product
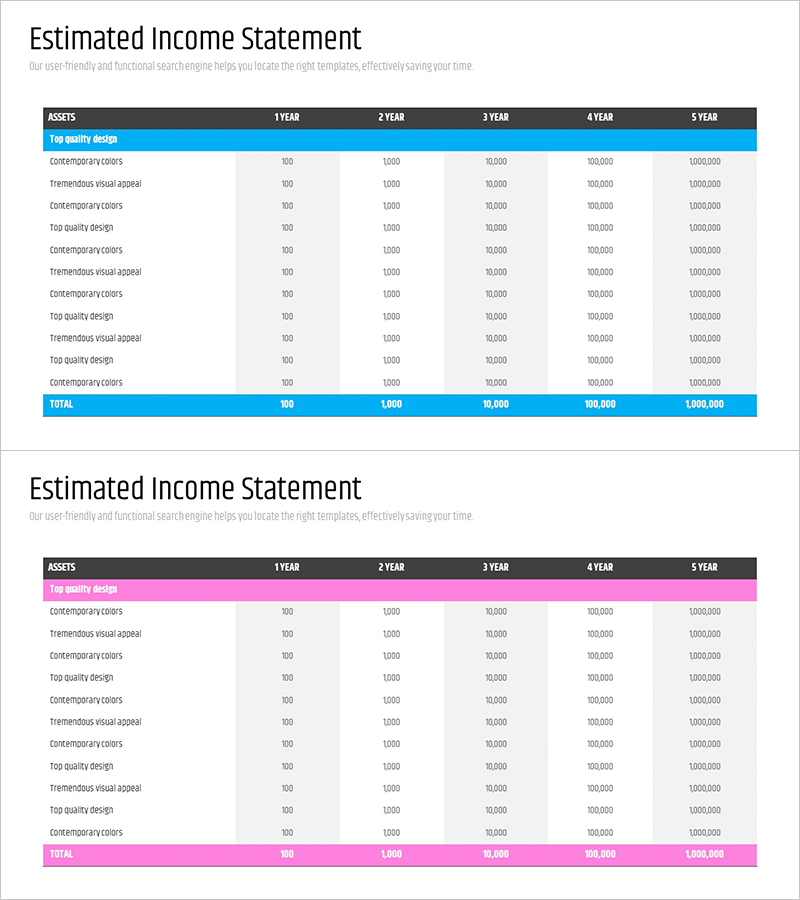
An intuitive financial data table PowerPoint slide designed to present sales and profit metrics side by side. The dual-tone blue and pink color scheme separates two data sections, enabling clear comparison of annual revenue, profit margins, growth rates, and other key financial indicators at a glance. The structured table layout with distinct rows and columns facilitates easy data entry and editing. This 16:9 widescreen slide set includes 2 slides ready for immediate use in business plans, investor pitch decks, financial reports, and quarterly earnings presentations. All text and numerical fields are fully editable in PPTX format.
Usage Points
-
Main Usage
Visualizes business financial performance and profitability through structured numerical data. Organizes annual revenue, profit margins, and growth rates in tabular format to clearly communicate financial health and earnings potential to investors, executives, and stakeholders.
-
How to Use
Insert into the financial section of business plans, financial overview pages of investor pitch decks, quarterly or annual financial reports, and earnings presentation materials. Populate the blue section with revenue and revenue growth figures, and the pink section with net profit and profit margin data to enable direct metric comparison.
-
Recommended For
CFOs, financial managers, executives, investor relations specialists, and business development professionals presenting financial performance. Ideal for startup investment pitches, corporate quarterly earnings announcements, and financial feasibility sections of new business proposals.
-
Slide Structure
Two-slide set with each slide divided into a title area at the top and a data table area below. The table features a left column for line items (Assets, Revenue, Profit, etc.) and right columns for year-by-year data (Year 1 through Year 5), with blue and pink headers clearly distinguishing the two data sections.
Related Products
-

Funding Plan Analysis Table – Clear Visualization of Financial Performance
#Financial Plans and Performance #Diagram #Capital Requirements
-

Fund Planning and Revenue Tables – Financial Performance Analysis
#Financial Plans and Performance #Diagram #Other
-

Navy Brown Profit Calculation Table
#Financial Plans and Performance #Diagram #Capital Requirements
-

Invoice of Required Funds for Financial Planning – A Slide for Efficient Fund Management
#Financial Plans and Performance #Diagram #Capital Requirements
