Annual Income Statement Slide
RM0100016_32
- Last Update 01/30/2025
- File Size 0.3MB
- # of Slides 2
- File Format PPTX
- Slide Ratio 16:9
- Color
Keywords
- #Content-Based Slides
- #Design-Based Slides
- #Financial Plans and Performance
- #Diagram
- #Capital Requirements
- #Sales and Revenue
- #Table
- #16:9
- #income statement PowerPoint slide
- #financial data table presentation
- #revenue statement slide
- #5-year financial comparison PPT
- #how to create an income statement in PowerPoint
About the Product
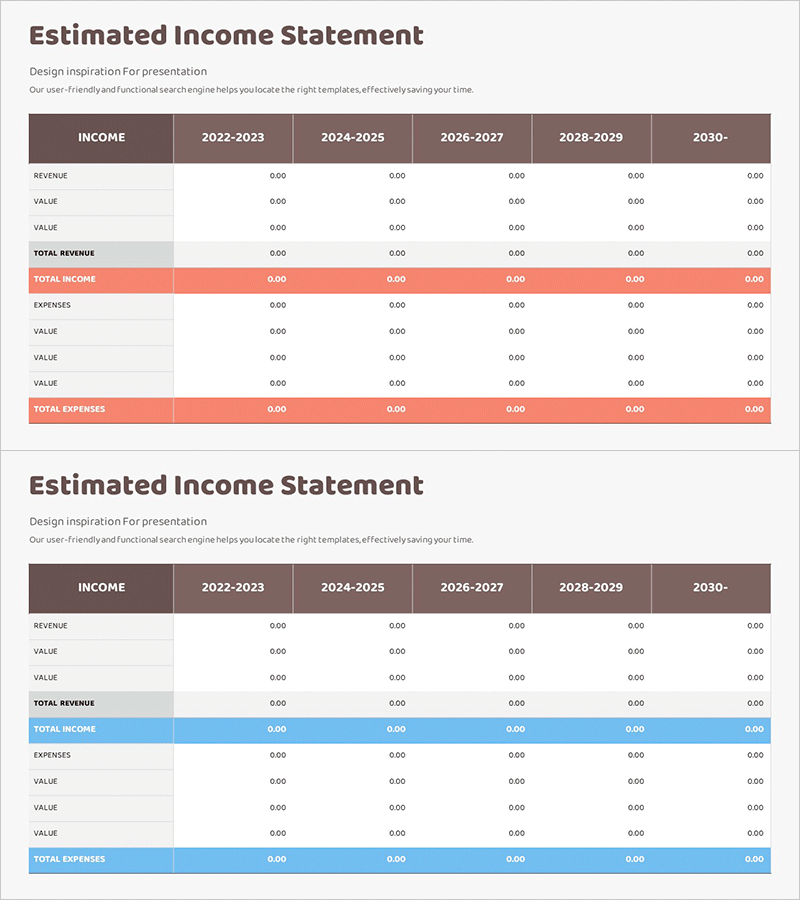
A professional income statement PowerPoint slide designed to visualize annual revenue and expense data across five fiscal years. This slide features a structured table format with rows for revenue, value items, total revenue, expenses, and total expenses spanning from 2022-2023 through 2030. The dark brown header row contrasts with a white background to maximize data readability, while total revenue and total expenses rows are highlighted in distinct accent colors (coral and blue) to emphasize key financial metrics. The slide is immediately ready for investor presentations, business plans, and financial reports.
Usage Points
-
Main Usage
This financial slide communicates a company's annual revenue, expenses, and net income performance with transparency and clarity. The structured table format presents income statement data in a way that builds investor confidence and demonstrates financial health. It serves as a critical component in business plans, investor relations materials, and quarterly or annual financial reports.
-
How to Use
Simply input your actual financial figures into the table cells and the slide is ready for presentation. The year-over-year comparison allows audiences to quickly assess revenue trends, expense structures, and profitability changes. The color-coded total rows (coral for income, blue for expenses) naturally draw attention to key metrics. Additional rows or columns can be inserted to accommodate more detailed line items if needed.
-
Recommended For
CFOs, financial managers, and executives presenting to investors, shareholders, or stakeholders will find this slide essential. It is ideal for startup pitch decks, corporate quarterly earnings presentations, annual financial reviews, and consulting firm financial analysis reports. Any presentation requiring data-driven financial communication benefits from this professional layout.
-
Slide Structure
The two-slide set features a dark brown header row with column labels (INCOME, 2022-2023, 2024-2025, 2026-2027, 2028-2029, 2030-) and organized sections: Revenue (with three value rows), Total Revenue (coral highlight), Expenses (with three value rows), and Total Expenses (coral highlight). The second slide provides an identical structure with blue accent colors as an alternative design option.
Related Products
-

Navy Brown Profit Calculation Table
#Financial Plans and Performance #Diagram #Capital Requirements
-

Estimated Income Report Analysis Table – Financial Planning and Performance
#Financial Plans and Performance #Diagram #Capital Requirements
-

Ranking Highlighting Bar Charts and Tables – Sales and Performance Management
#Financial Plans and Performance #Diagram #Graph
-

Funding Plan Analysis Table – Clear Visualization of Financial Performance
#Financial Plans and Performance #Diagram #Capital Requirements
