Media Utilization Graph – Visualizing Market Trends
RJ0800026_8
- Last Update 08/07/2025
- File Size 0.9MB
- # of Slides 2
- File Format PPTX
- Slide Ratio 16:9
- Color
Keywords
- #Content-Based Slides
- #Design-Based Slides
- #Company Introduction
- #Market and Competitor Analysis
- #Other
- #Global Network
- #Market Status
- #Map
- #16:9
- #global map PowerPoint slide
- #market overview presentation
- #regional data visualization
- #world map graph slide
- #how to visualize global data in PowerPoint
About the Product
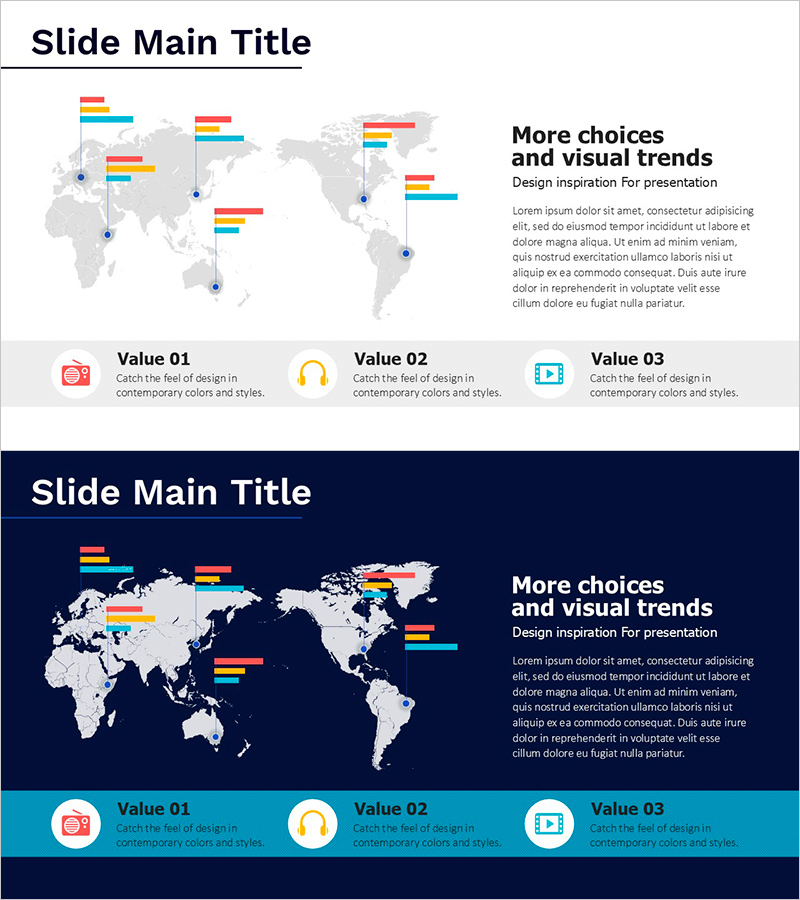
A PowerPoint slide that visualizes regional data across a world map using horizontal bar charts. Two versions are provided—light background and dark background—allowing you to match your presentation tone. Ideal for comparing global media utilization rates, market share, and regional performance metrics at a glance. The layout includes a title section at the top, descriptive text on the right, and three icon-based value points at the bottom, making it ready to use in company overview, market analysis, and global network presentations. Delivered in 16:9 widescreen PPTX format, fully editable in all PowerPoint versions.
Usage Points
-
Main Usage
Communicate global market conditions, regional performance data, media utilization rates, and market share by visualizing information on a world map. Enables investors, partners, and stakeholders to grasp regional differences and trends instantly during international business presentations.
-
How to Use
Insert into the Global Network section of company overview decks, regional market analysis pages in business reports, or global expansion strategy sections in strategic presentations. Simply edit the bar chart values and descriptive text with your own data for immediate use.
-
Recommended For
Executives, marketing teams, and business development professionals at global corporations presenting international market conditions. Also suitable for consulting firms, research institutions, and financial investment companies presenting regional analysis data.
-
Slide Structure
Title area at top (Slide Main Title), world map with multi-region bar charts in center, descriptive text block on right (More choices and visual trends), and three icon-based value points at bottom (Value 01/02/03). Clear information hierarchy ensures complex global data remains readable and visually organized.
Related Products
-

Global Market Entry & Data-Based Market Analysis Chart
#Company Introduction #Market and Competitor Analysis #Graph
-

Global Market Outlook Analysis – Diagram Based Presentation
#Company Introduction #Market and Competitor Analysis #Diagram
-

Green Energy Chart Map – Global Market Analysis
#Company Introduction #Market and Competitor Analysis #Graph
-

Global Business Market Outlook Circular Diagram
#Company Introduction #Market and Competitor Analysis #Diagram
