Expected Investment Return Calculation Slide
RM0500009_27
- Last Update 02/22/2025
- File Size 0.5MB
- # of Slides 2
- File Format PPTX
- Slide Ratio 16:9
- Color
Keywords
- #Content-Based Slides
- #Design-Based Slides
- #Financial Plans and Performance
- #Diagram
- #Projected Return on Investment (ROI)
- #Budget
- #Table
- #16:9
- #investment return calculation table PPT
- #financial data slide PowerPoint
- #ROI comparison slide
- #three-column table template
- #financial planning presentation slide
About the Product
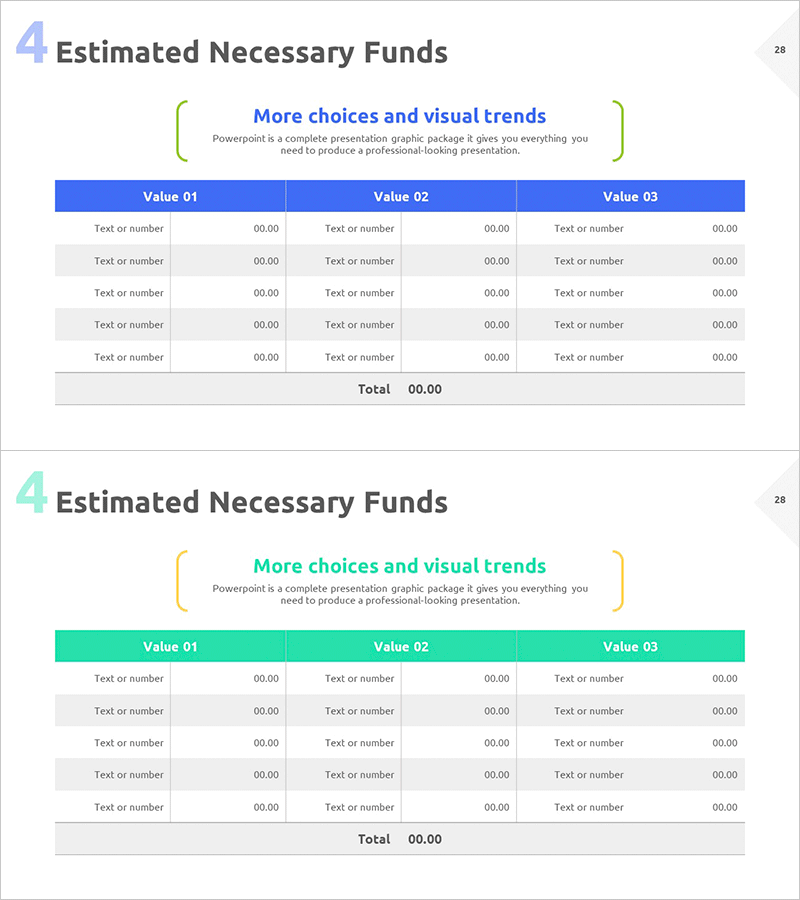
A financial data table PowerPoint slide designed for investment return analysis and ROI comparison. This slide features a three-column layout (Value 01, 02, 03) enabling side-by-side comparison of investment scenarios. The design includes five text input rows with clearly separated numerical entry fields, a blue header row for visual hierarchy, and alternating gray-white rows for improved data readability. A total calculation row is included at the bottom for quick financial assessment. Provided in 16:9 PPTX format, this slide allows you to complete investment decision-making presentations by simply entering your financial figures and data.
Usage Points
-
Main Usage
This slide visualizes investment return analysis and financial forecast data, enabling comparison of three investment scenarios or alternatives side by side. With clearly separated text input areas and numerical entry fields, it is optimized for the financial sections of corporate financial reports, investment proposals, and business plans.
-
How to Use
Enter investment scenario names in each Value column header, then fill in item labels (e.g., initial investment, annual revenue, payback period) in the text rows below. Input corresponding numerical values in the right-aligned fields. The total row can be auto-calculated or manually entered. Customize colors and fonts to match your corporate brand. During presentation, highlight numerical differences between Value columns to clearly demonstrate investment decision rationale.
-
Recommended For
Ideal for CFOs, financial managers, investment officers, and executives presenting investment reviews or shareholder reports. Commonly used in startup fundraising pitches, corporate business plan financial sections, and capital allocation decision documents. Particularly valuable in finance, consulting, manufacturing, and other data-driven decision-making organizations.
-
Slide Structure
The slide comprises a title area, three Value column headers with blue background, five text input rows with alternating gray-white backgrounds, right-aligned numerical entry fields, and a highlighted total row. Each row contains an item label and three numerical input cells, creating an optimized structure for comparative financial analysis.
Related Products
-

Expected Funding Needs Analysis Table – Financial Planning and Performance
#Financial Plans and Performance #Diagram #Projected Return on Investment (ROI)
-

Startup Funding Needs Analysis Chart
#Financial Plans and Performance #Diagram #Projected Return on Investment (ROI)
-

Potential and Plans for Attracting Additional Investment - Projected ROI and Strategic Budget Analysis
#Financial Plans and Performance #Diagram #Projected Return on Investment (ROI)
-

Environmental Pollution Infographic Table Template
#Financial Plans and Performance #Diagram #Projected Return on Investment (ROI)
