Construction Company History Diagram – Visualizing Business Strategy
RM0500004_6
- Last Update 02/21/2025
- File Size 1.4MB
- # of Slides 2
- File Format PPTX
- Slide Ratio 16:9
- Color
Keywords
- #Content-Based Slides
- #Design-Based Slides
- #Company Introduction
- #Business Strategy
- #Diagram
- #History
- #Step-by-Step Schedule Plan
- #Cluster
- #Chain Diagram
- #16:9
- #timeline diagram PowerPoint
- #connection diagram slide
- #business history presentation
- #company timeline template
- #roadmap diagram PowerPoint
- #process timeline slide design
About the Product
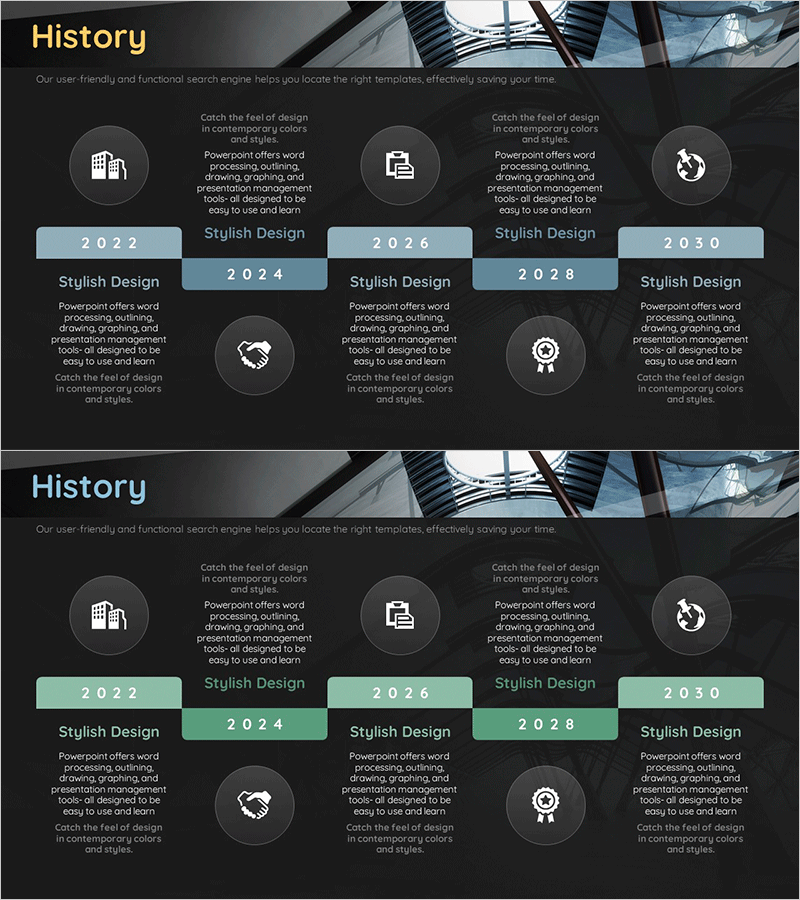
A professional timeline connection diagram PowerPoint slide that visualizes your company's business progression and strategic evolution. This 2-slide deck features 6 interconnected nodes arranged chronologically, each with dedicated icon and text areas for customization. The dark background with light blue accent colors creates a corporate aesthetic suitable for construction, manufacturing, finance, and technology sectors. Perfect for company history presentations, business roadmap timelines, and strategic milestone communications. Each node provides independent editing space for seamless customization, and the slide deck integrates directly with presentation management tools for immediate deployment.
Usage Points
-
Main Usage
Illustrates your organization's key business phases and strategic shifts across a chronological timeline. Each node represents a specific year, project milestone, or business achievement, with connecting lines showing causality and continuity. Effectively communicates company evolution to investors, partners, and new employees during corporate introductions and business briefings.
-
How to Use
Input year, business name, and key achievements into each node's text box, then customize icons to match your industry or business type. Use color variations to distinguish time periods or business phases for enhanced emphasis. Slide 1 serves as the comprehensive timeline overview, while Slide 2 provides detailed exploration of a specific era or initiative.
-
Recommended For
Ideal for construction, manufacturing, finance, and technology companies preparing company profiles, business plans, and investor pitch decks. Particularly effective for executive and management presentations explaining long-term business development, technology roadmaps, and organizational expansion histories.
-
Slide Structure
Linear timeline composed of 6 interconnected nodes, each containing a circular icon, year/period label, and dedicated text description area. Connecting lines between nodes emphasize cause-and-effect relationships. Dark background with light blue accent colors establishes visual hierarchy. 16:9 widescreen format optimized for modern projectors and displays.
Related Products
-

Text Box History Diagram Template – Company Introduction and Business Strategy
#Company Introduction #Business Strategy #Diagram
-

History Linear Diagram - Concisely Visualizing Company Growth and Changes
#Company Introduction #Business Strategy #Diagram
-

History Connection Diagram – Stepwise Business Strategy
#Company Introduction #Business Strategy #Diagram
-

History Connection Diagram – Business Strategy
#Company Introduction #Business Strategy #Diagram
