Year-by-year History Area Diagram – Journey of Business Development
RM0100016_5
- Last Update 01/30/2025
- File Size 0.3MB
- # of Slides 2
- File Format PPTX
- Slide Ratio 16:9
- Color
Keywords
- #Content-Based Slides
- #Design-Based Slides
- #Company Introduction
- #Business Strategy
- #Diagram
- #History
- #Step-by-Step Schedule Plan
- #Cluster
- #Chain Diagram
- #16:9
- #history area diagram PowerPoint
- #year-by-year timeline slide
- #business growth chart template
- #area graph presentation
- #timeline diagram download
About the Product
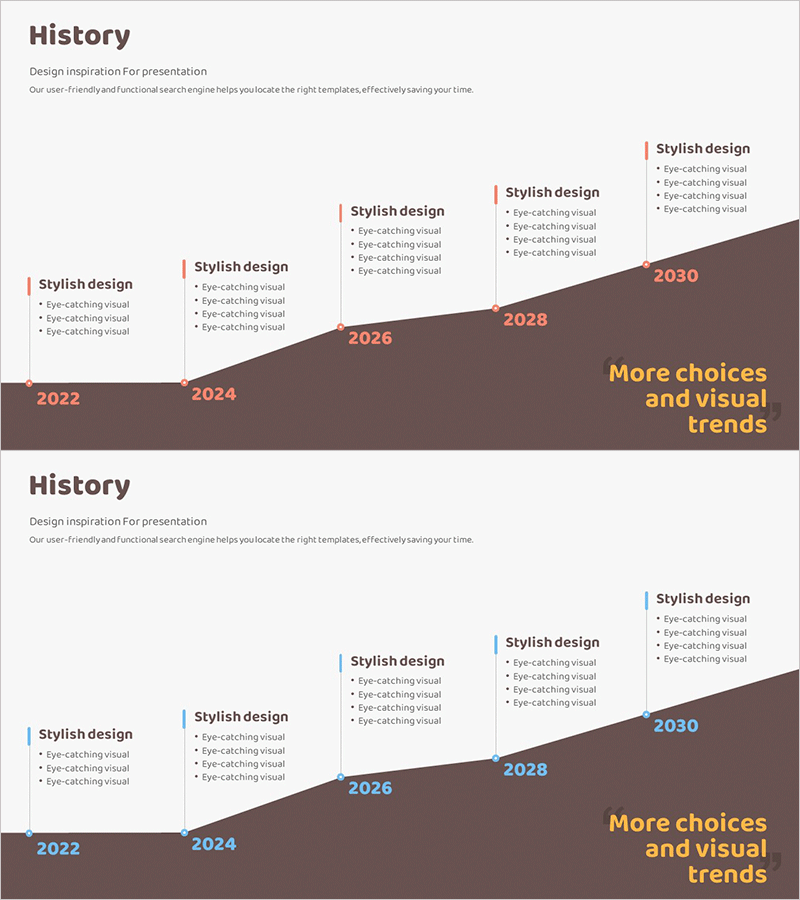
A PowerPoint area diagram slide that visualizes your company's business development journey from 2022 to 2030 across five key milestones. The brown gradient area represents cumulative growth over time, with each year marked by an orange label and dedicated text boxes for key achievements and strategic vision. This 16:9 widescreen 2-slide template is ready to use for company history presentations, business development reports, and strategic roadmap discussions. The contrast between the orange year markers and brown background creates an intuitive visual flow of time progression, making it ideal for investor presentations and corporate communications.
Usage Points
-
Main Usage
Effectively communicate your company's evolution and growth trajectory by visualizing key milestones across multiple years in a single, cohesive visual. The area diagram format emphasizes cumulative progress and momentum, making it ideal for demonstrating business maturity, market expansion, and strategic achievements to stakeholders.
-
How to Use
Replace the placeholder text in each year's text box (2022, 2024, 2026, 2028, 2030) with your actual milestones, product launches, market entries, or revenue achievements. The brown gradient area automatically conveys growth momentum, while the right-side message area can highlight future vision or strategic direction. Customize colors and text to match your corporate branding.
-
Recommended For
Corporate executives, investor relations managers, business development professionals, and marketing strategists presenting company history, growth narratives, and long-term strategy. Ideal for shareholder meetings, client pitches, recruitment presentations, media briefings, and annual reports where demonstrating business momentum is critical.
-
Slide Structure
2-slide template featuring a 5-point timeline (2022, 2024, 2026, 2028, 2030) represented by a continuous brown gradient area. Each year has an orange label marker and an adjacent text box for content. The right side includes five 'Stylish design' bullet-point sections and a final message area. Optimized for 16:9 widescreen display format.
Related Products
-

Social Media Linear Diagram – Stages of Business Growth
#Company Introduction #Business Strategy #Diagram
-

Diagram Introducing the History of All Time – Business Growth and Development
#Company Introduction #Business Strategy #Diagram
-

Business Plan History Diagram – Stepwise Flow Representation
#Company Introduction #Business Strategy #Diagram
-

History Connection Diagram – Business Strategy
#Company Introduction #Business Strategy #Diagram
