Balance Sheet Table Chart – Visualizing Financial Plans and Performance
RM0500003_26
- Last Update 02/20/2025
- File Size 0.7MB
- # of Slides 2
- File Format PPTX
- Slide Ratio 16:9
- Color
Keywords
- #Content-Based Slides
- #Design-Based Slides
- #Financial Plans and Performance
- #Diagram
- #Balance Sheet
- #Key Financial Indicators
- #Table
- #16:9
- #balance sheet PowerPoint slide
- #financial table presentation
- #balance sheet data visualization
- #investor report template
- #how to create a balance sheet in PowerPoint
About the Product
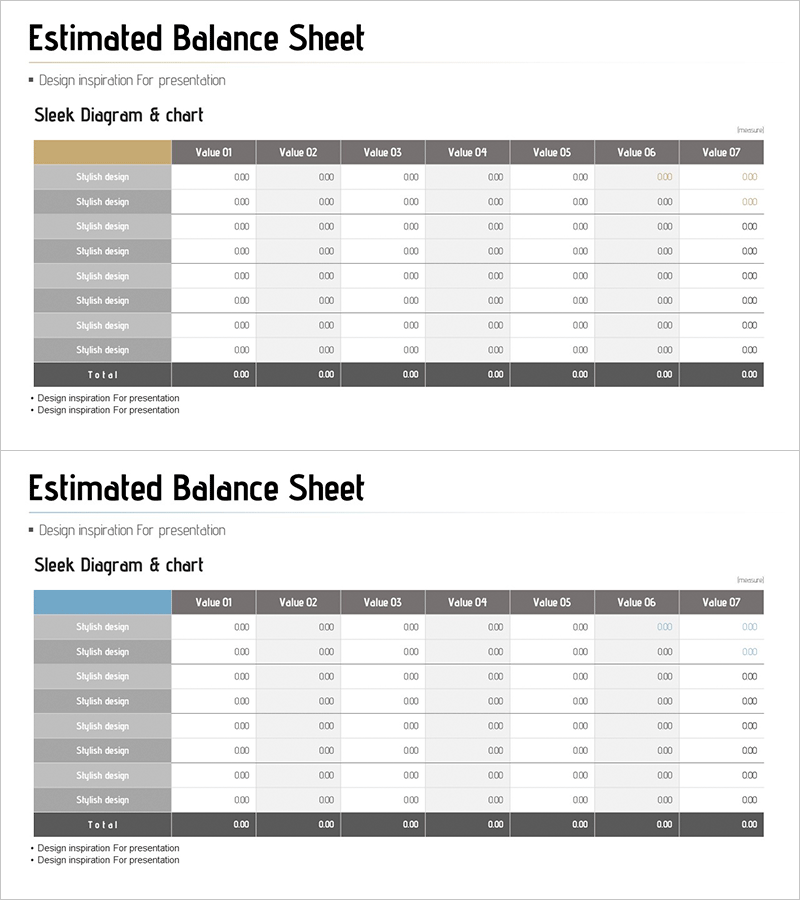
A professional balance sheet PowerPoint slide designed to present financial data with clarity and precision. The table features 8 rows and 7 columns, organizing assets, liabilities, and equity items in a structured format for easy comparison of financial figures. The beige and blue dual-tone header combined with gray row dividers creates clear information hierarchy, while the emphasized total row highlights key metrics. This presentation slide is ready to use in investor reports, IR materials, and financial analysis presentations.
Usage Points
-
Main Usage
Present financial statement data—assets, liabilities, and equity—in a structured table format to communicate financial position transparently. Supports data-driven decision-making and builds stakeholder confidence through clear numerical visualization.
-
How to Use
Use in investor relations materials, quarterly and annual financial reports, and executive briefing presentations. Input actual financial figures into each cell; the table structure supports real-time data updates and automatic total calculations.
-
Recommended For
CFOs, finance teams, investor relations departments, executive management, and banking/financial institutions preparing loan review materials. Ideal for public company disclosures, private equity due diligence documentation, and financial audit presentations.
-
Slide Structure
Header row with beige background displaying Value 01–07 column titles; left-side row labels with 8 'Stylish design' items; right-side total row in dark gray. Data cells use light gray background to clearly delineate input areas, maintaining readability when numerical data is entered.
Related Products
-

Green Brown Statistics Table – Financial Performance Analysis
#Financial Plans and Performance #Diagram #Balance Sheet
-

Origami Concept Table – Visualizing Financial Performance
#Financial Plans and Performance #Diagram #Balance Sheet
-

Triangle Pattern PPT Table Chart – Visualizing Financial Performance
#Financial Plans and Performance #Diagram #Balance Sheet
-

Balance Sheet Chart for Financial Planning Slide
#Financial Plans and Performance #Diagram #Balance Sheet
