History Linear Diagram – Visualizing Business Launch Strategy
RM0500003_6
- Last Update 02/20/2025
- File Size 0.6MB
- # of Slides 2
- File Format PPTX
- Slide Ratio 16:9
- Color
Keywords
- #Content-Based Slides
- #Design-Based Slides
- #Company Introduction
- #Business Strategy
- #Diagram
- #History
- #Step-by-Step Schedule Plan
- #16:9
- #history timeline PowerPoint slide
- #business launch strategy diagram
- #5-stage timeline presentation
- #company growth visualization PPT
- #linear timeline PowerPoint template
About the Product
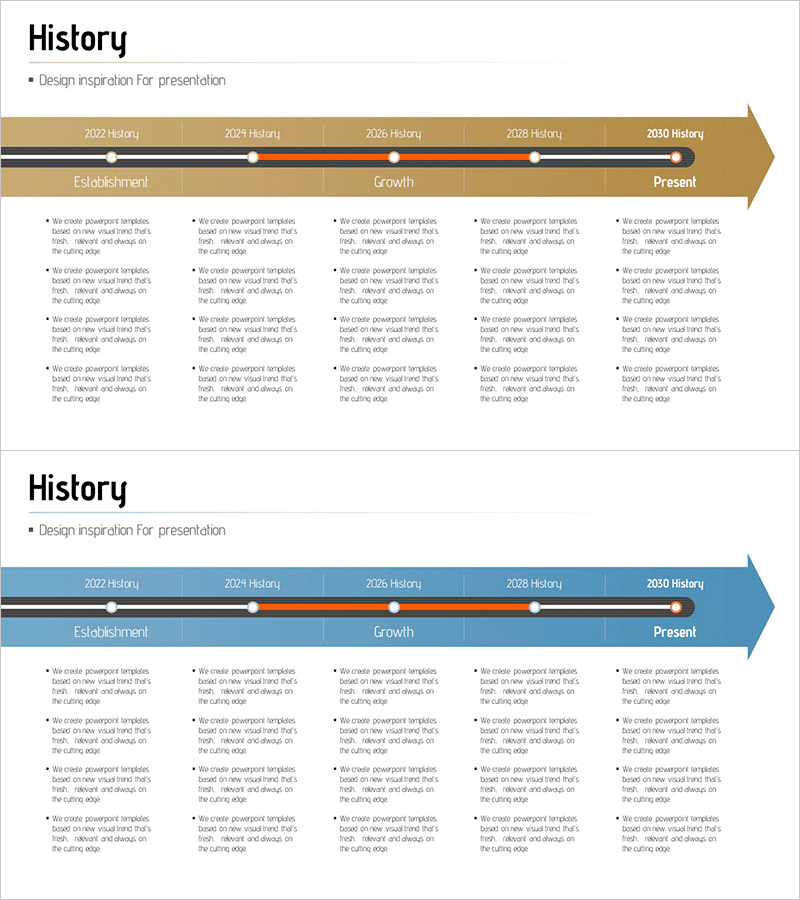
A history timeline diagram PowerPoint slide that visualizes a company's business development process across five stages in a linear arrow format. The slide clearly distinguishes establishment, growth, and present phases, with four text input areas beneath each stage for detailed descriptions. Available in two color versions—gold and blue—allowing you to match your corporate brand identity. Ideal for investor presentations, company introductions, and business plan pitches to convey organizational growth with credibility. Formatted in 16:9 widescreen with two slides, ready for immediate editing and deployment.
Usage Points
-
Main Usage
Effectively communicate your company's development journey from founding to present day to investors, partners, and clients by displaying growth milestones in a clear, chronological timeline format. Each stage distinctly highlights key achievements and strategic milestones, reinforcing organizational credibility and execution capability.
-
How to Use
Use this slide in IR materials, company overview presentations, or business plan pitches as the company history section. Alternatively, apply it to project timelines by entering specific achievements, metrics, and key events in each stage's text areas to enhance audience comprehension.
-
Recommended For
Recommended for executives, IR specialists, and marketing teams presenting at investor pitches, due diligence meetings, partnership negotiations, employee onboarding sessions, and shareholder meetings where a compelling growth narrative is essential.
-
Slide Structure
A linear arrow timeline displays five year intervals (2022, 2024, 2026, 2028, 2030) with three phase labels—Establishment, Growth, Present—positioned below. Each phase contains four text input areas, providing twelve total information points for comprehensive storytelling.
Related Products
-

Social Media Linear Diagram – Stages of Business Growth
#Company Introduction #Business Strategy #Diagram
-

History Connection Diagram – Business Strategy
#Company Introduction #Business Strategy #Diagram
-

Basic History Introduction Slides – Overview of Company History
#Company Introduction #Business Strategy #Diagram
-

History Layer Diagram – Effectively Organizing Business Advancement Strategies
#Company Introduction #Business Strategy #Diagram
