Potential and Plans for Attracting Additional Investment - Projected ROI and Strategic Budget Analysis
RM0500002_27
- Last Update 02/20/2025
- File Size 1.1MB
- # of Slides 2
- File Format PPTX
- Slide Ratio 16:9
- Color
Keywords
- #Content-Based Slides
- #Design-Based Slides
- #Financial Plans and Performance
- #Diagram
- #Projected Return on Investment (ROI)
- #Budget
- #Table
- #16:9
- #investment ROI PowerPoint slide
- #financial data table presentation
- #investment pitch slide deck
- #budget analysis PPT
- #how to present financial projections in PowerPoint
About the Product
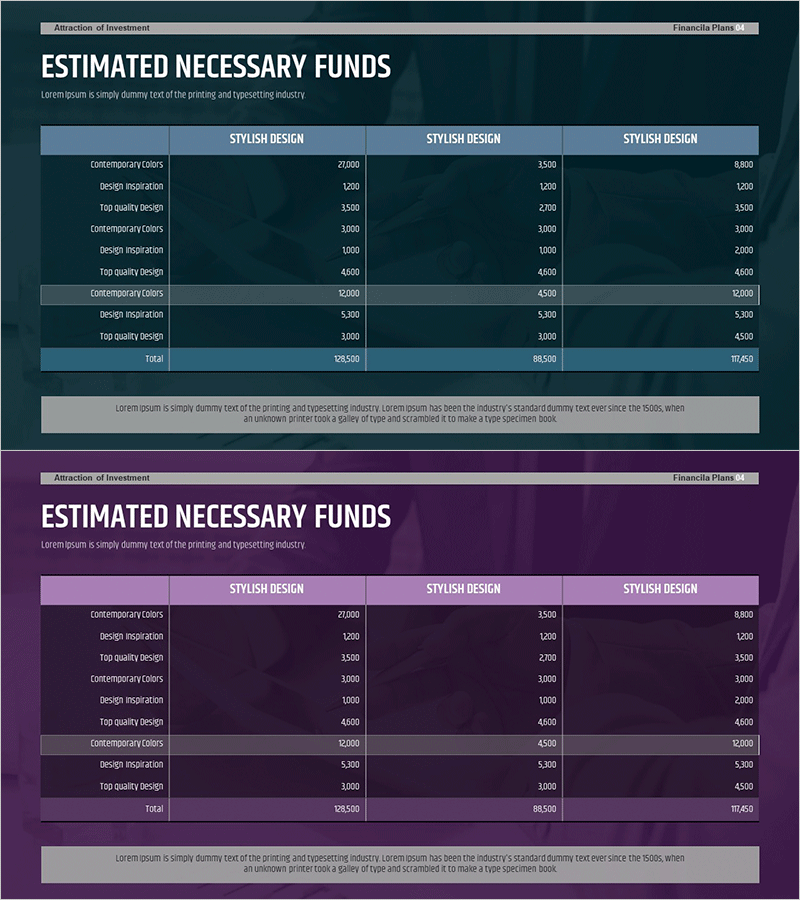
An essential PowerPoint slide for investment pitch and financial planning presentations, featuring investment ROI projections and budget analysis. The slide uses a dark teal background with white headers and blue accent colors in a 3-column comparison table layout, clearly visualizing financial data by investment category. The 2-slide set allows repeated use of the same structure for multiple financial datasets, optimized for 16:9 widescreen format in modern presentation environments. Ideal for investor pitches, IR materials, financial planning reports, and strategic budget allocation presentations.
Usage Points
-
Main Usage
Presents projected returns, investment category costs, and financial metrics in a data-driven format for investment pitches and financial planning presentations. Designed to support investor decision-making through a comparative data structure.
-
How to Use
Enter investment scenario names (e.g., conservative, moderate, aggressive) in the 3 column headers, then input investment items (capital requirements, ROI percentages, balance sheet items) and corresponding figures in each row. The 2-slide format allows sequential presentation of multiple financial metrics.
-
Recommended For
CFOs, financial managers, and investment executives presenting financial plans and profitability analysis during investor pitches, shareholder meetings, and investment fundraising meetings. Suitable for startup funding pitches and corporate expansion plan presentations.
-
Slide Structure
Both slides share identical structure with a title area, 3-column header row, and 9 data cells (3 rows × 3 columns). Total text input areas: 13 (1 title + 3 headers + 9 data cells), with a numeric data-focused comparative layout.
Related Products
-

Medical Business Expected Funding Requirements Table – Efficient Financial Planning
#Financial Plans and Performance #Diagram #Projected Return on Investment (ROI)
-

Marketing Budget Analysis Table – Optimized for Financial Performance
#Financial Plans and Performance #Diagram #Projected Return on Investment (ROI)
-

Expected Return on Investment Chart – Visualizing Financial Performance
#Financial Plans and Performance #Diagram #Projected Return on Investment (ROI)
-

Expected Funding Needs Analysis Table – Financial Planning and Performance
#Financial Plans and Performance #Diagram #Projected Return on Investment (ROI)
