Table of Main Revenue Sources and Cost Analysis
RM0500002_25
- Last Update 02/20/2025
- File Size 1.1MB
- # of Slides 2
- File Format PPTX
- Slide Ratio 16:9
- Color
Keywords
About the Product
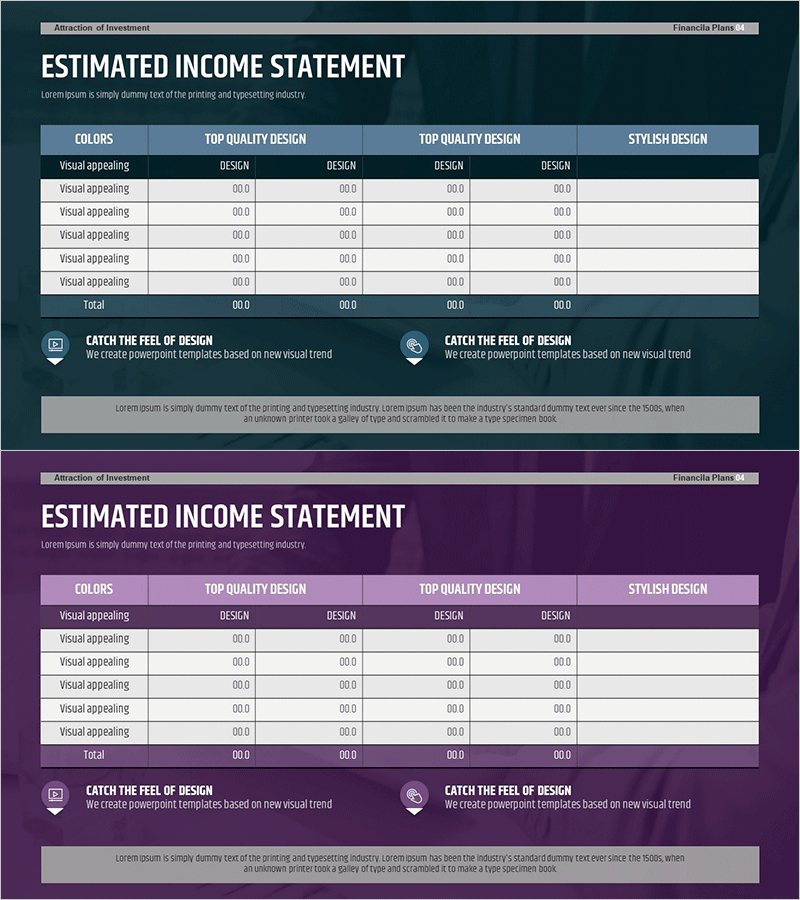
A financial data visualization PowerPoint slide featuring an income statement table with a dark blue header and white data area. The 4-column comparison layout enables side-by-side analysis of revenue sources, costs, and design items. This 2-slide PPTX presentation is ready for immediate use in financial presentations, estimated income statements, cost analysis, and revenue trend reports. Clearly defined text input areas make it easy to communicate your company's financial status to investors and executives.
Usage Points
-
Main Usage
Communicate financial performance through structured numerical data and tables. This slide is designed for financial sections covering income statements, projected financial analysis, and cost structure breakdowns, supporting decision-making by investors, executives, and stakeholders.
-
How to Use
Enter item names (revenue sources, costs, design categories) in the dark blue header row, then input specific numerical values in the white data rows. The 4-column structure allows year-over-year, departmental, or scenario-based financial comparisons to strengthen analytical presentation.
-
Recommended For
CFOs, finance managers, executives, and investor relations professionals presenting IR materials, business plans, financial reports, and quarterly earnings statements. Particularly effective for income statements, balance sheets, and cash flow statements where numerical clarity is critical.
-
Slide Structure
2-slide set with dark blue header row and 6 data rows per table. First slide presents primary financial data; second slide offers an identical layout for comparative analysis. All cells support text input, with headers in fixed color and alternating white and light gray data rows for optimal readability.
Related Products
-

Internet Shopping Sales and Profit Calculation Chart – Your Business Success Guide
#Financial Plans and Performance #Diagram #Graph
-

Sales and Profit Table Diagram
#Financial Plans and Performance #Diagram #Income Statement
-

Transportation Business Sales and Profit Table – Financial Analysis
#Financial Plans and Performance #Diagram #Income Statement
-

Sales and Profit Table – Financial Performance Visualization
#Financial Plans and Performance #Diagram #Income Statement
