Business Linear Direction Diagram – Visualization of Business Strategy and Goals
RM0500002_19
- Last Update 02/20/2025
- File Size 2.2MB
- # of Slides 2
- File Format PPTX
- Slide Ratio 16:9
- Color
Keywords
About the Product
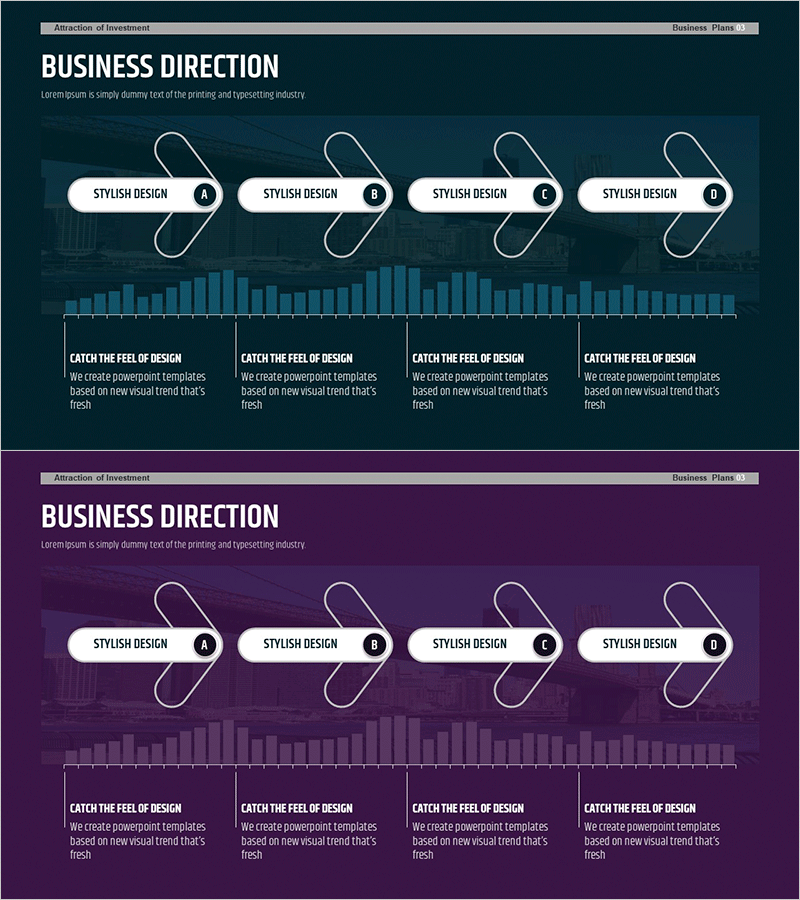
A 4-step linear direction diagram PowerPoint slide that visualizes business strategy and goals in sequential stages. Featuring a dark blue background with white curved arrow connectors linking four nodes, each with editable text boxes for stage-specific content. The lower section includes a bar graph element for data visualization, making it ideal for presentations on business direction, process flow, and goal achievement milestones. Ready-to-use 2-slide set for immediate deployment in strategy presentations.
Usage Points
-
Main Usage
Visualizes business strategy execution, goal achievement pathways, process workflows, and phased implementation plans. The 4-node structure emphasizes critical stages, allowing teams to input stage names, objectives, and action items to enhance organizational alignment and stakeholder understanding.
-
How to Use
Enter stage names, objectives, and execution details into each node's text box. Modify arrow connectors to reflect your strategy structure—sequential progression, circular cycles, or parallel workflows. Add performance metrics or progress indicators to the bar graph section below for enhanced data storytelling and persuasive impact.
-
Recommended For
Executives, strategy teams, project managers, and business planners presenting business direction, roadmaps, and organizational strategy to employees, investors, and clients. Ideal for quarterly business planning, project kickoffs, strategic reports, and investment pitch presentations.
-
Slide Structure
2-slide set with dark blue background. Each slide features 4 nodes (white rounded boxes) connected by curved white arrows in linear flow. Circular numbered badges (A, B, C, D) positioned right of each node emphasize stage sequence. Bar graph visualization area at bottom provides space for data representation and performance tracking.
Related Products
-

Business Future Goals Diagram – Clarifying Business Objectives
#Business Vision and Strategy #Diagram #Business Strategy
-

Camping Business Goal Diagram – Growth and Direction Setting
#Business Vision and Strategy #Diagram #Business Strategy
-

Goal & Vision Slide Template – Communicating Strategies and Vision
#Business Vision and Strategy #Diagram #Business Strategy
-

Eco-friendly Business Goal Market Strategy Diagram – Sustainable Development
#Business Vision and Strategy #Diagram #Business Strategy
