Business Future Goals Diagram – Clarifying Business Objectives
RJ0300018_8
- Last Update 04/22/2025
- File Size 2.6MB
- # of Slides 2
- File Format PPTX
- Slide Ratio 16:9
- Color
Keywords
About the Product
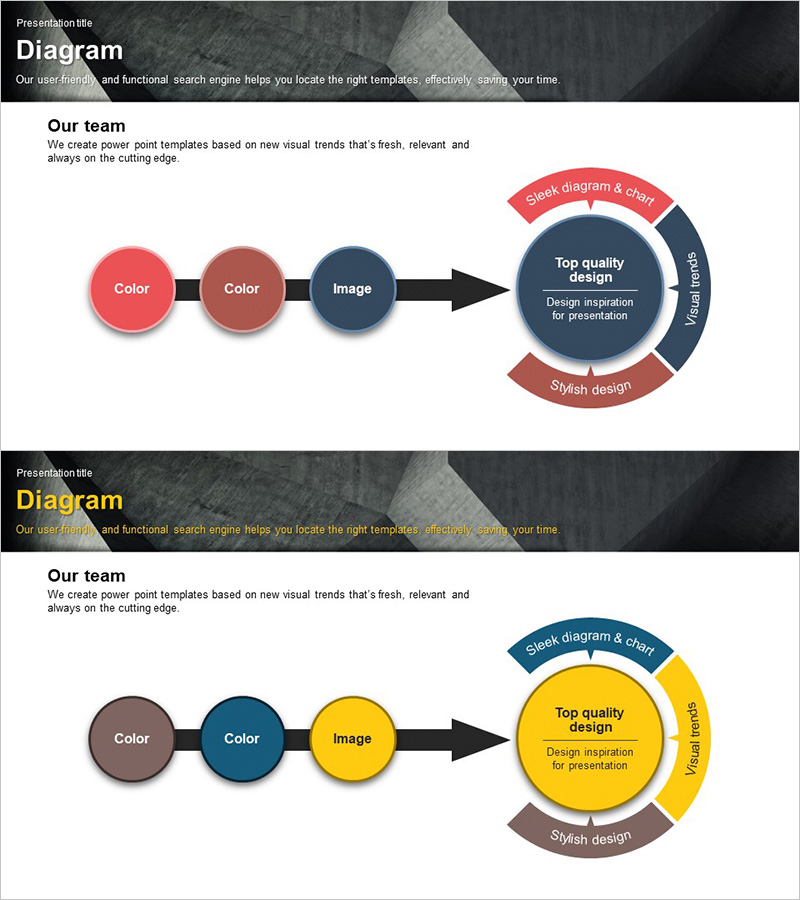
A linear flow diagram PowerPoint slide that clearly expresses business objectives through sequential stages. Three circular nodes connected by black arrows visualize a step-by-step process, while the right-side radial diagram simultaneously represents core goals and detailed strategies. The color combination of red, brown, and navy blue emphasizes business credibility, and two color versions (red and yellow tones) are provided for immediate use in presentations and reports. Optimized for modern presentation environments in 16:9 widescreen PPTX format.
Usage Points
-
Main Usage
This slide is designed to clearly communicate future direction through sequential stages during business goal setting and strategy development phases. The linear flow expresses step-by-step execution plans, while the radial structure simultaneously represents the relationship between core objectives and detailed strategies, effectively conveying business vision to executives, team members, and investors.
-
How to Use
Enter stage-by-stage goals (e.g., Color→Color→Image) in the three circular nodes on the left side, and input core objectives in the central circle and detailed strategies in surrounding sections of the right radial diagram. Text size and colors are fully editable, and you can select between two color versions that match your presentation tone.
-
Recommended For
Ideal for executives, business planning teams, marketing managers, and consultants presenting business strategies, annual goal-setting meetings, investor presentations, and business plan documents. Particularly effective when expressing both step-by-step execution plans and strategic objectives simultaneously.
-
Slide Structure
Left linear flow: Three circular nodes (approximately 60px diameter) sequentially connected by black arrows (8px thickness). Right radial structure: Four arc sections (red, brown, navy blue, gray) arranged around a central navy circle (approximately 120px diameter) representing core goals and four strategic areas. Overall layout optimized for 16:9 widescreen format.
Related Products
-

Setting Successful Business Goals – Linear Flow Diagram
#Business Vision and Strategy #Diagram #Business Strategy
-

Functional Value Proposition Slide – Business Strategy Presentation
#Business Vision and Strategy #Diagram #Business Strategy
-

Medical Business Process Diagram – Maximizing Efficiency
#Business Vision and Strategy #Diagram #Business Strategy
-

Comprehensive Strategy Derived from Keywords – Business Vision and Goals
#Business Vision and Strategy #Diagram #Business Strategy
