Business Logistics and Supply Chain Status Diagram
RM0500002_11
- Last Update 02/20/2025
- File Size 1.1MB
- # of Slides 2
- File Format PPTX
- Slide Ratio 16:9
- Color
Keywords
- #Content-Based Slides
- #Design-Based Slides
- #Business Introduction
- #Diagram
- #Business Areas
- #Infrastructure
- #Cluster
- #Table
- #Combination Diagram
- #16:9
- #overlapping cluster diagram PowerPoint
- #business infrastructure presentation slide
- #three-circle Venn diagram template
- #supply chain visualization PPT
- #business analysis slide template
- #how to create cluster diagram in PowerPoint
About the Product
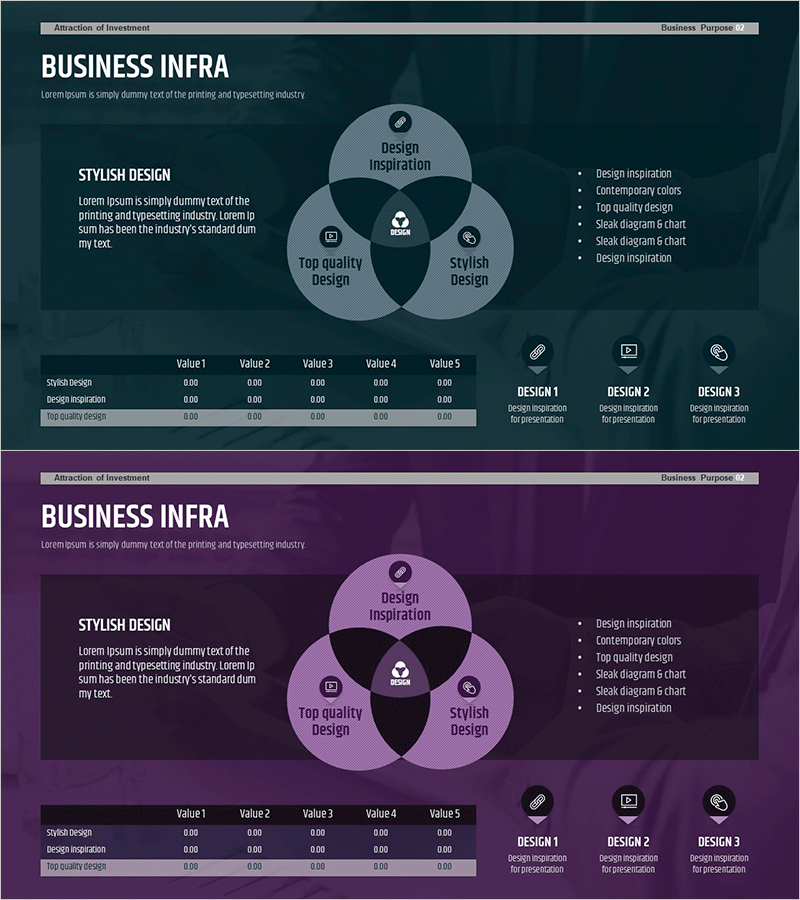
A professional PowerPoint slide featuring three overlapping circular nodes that visualize business logistics and supply chain status. The design emphasizes design inspiration, top quality design, and stylish design as core elements, with a dark teal background and gray-toned circular clusters creating an intuitive representation of complex relationships. Each slide includes a data table with five value columns for immediate input of business metrics. The 16:9 widescreen format with two-slide composition is optimized for corporate presentations, business introductions, and strategic planning sessions where multi-layered system analysis is required.
Usage Points
-
Main Usage
Presents complex business relationships and interactions through three layered circular nodes, enabling stakeholders to instantly grasp interconnections and influence between core elements. Particularly effective for analyzing multi-layered systems such as logistics networks, supply chains, and infrastructure ecosystems where hierarchical relationships must be clearly communicated.
-
How to Use
Enter the primary concept in the central circular node, place supporting elements in surrounding nodes, and input quantitative data for five metrics in the bottom table. The dark teal background and gray-toned circles reinforce business credibility, while additional icons and text boxes can be inserted to represent supplementary information or annotations.
-
Recommended For
Ideal for business strategy development, supply chain management, logistics system analysis, organizational structure explanation, and business model presentation. Recommended for executives, planning teams, consultants, and marketing professionals preparing investment pitches, business plans, proposals, and corporate introductions where complex concepts require visual clarity.
-
Slide Structure
Two-slide composition, each featuring three overlapping circular nodes (three-node cluster with intersection structure) and a five-column data table at the bottom. The first slide demonstrates 'design inspiration, top quality design, stylish design' elements, while the second slide maintains identical structure for alternative business concepts or comparative analysis.
Related Products
-

Banking Services Analysis and Organization – Visual Understanding Diagram
#Company Introduction #Business Introduction #Diagram
-

Photo Business Market Analysis - Insights through Data Visualization
#Company Introduction #Business Introduction #Diagram
-

IT Industry Infrastructure Connection Diagram – Business Area Overview
#Business Introduction #Diagram #Business Areas
-

Business Area Overlap Diagram – Integration of Strategy and Vision
#Business Introduction #Business Vision and Strategy #Diagram
