Banking Services Analysis and Organization – Visual Understanding Diagram
RJ0300081_26
- Last Update 05/11/2025
- File Size 0.1MB
- # of Slides 2
- File Format PPTX
- Slide Ratio 16:9
- Color
Keywords
- #Content-Based Slides
- #Design-Based Slides
- #Company Introduction
- #Business Introduction
- #Diagram
- #Business Areas
- #Business Areas
- #Cluster
- #Table
- #Combination Diagram
- #16:9
- #nested diagram PowerPoint
- #5-node circular diagram slide
- #banking services analysis template
- #relationship diagram PPT
- #diagram PowerPoint slide design
About the Product
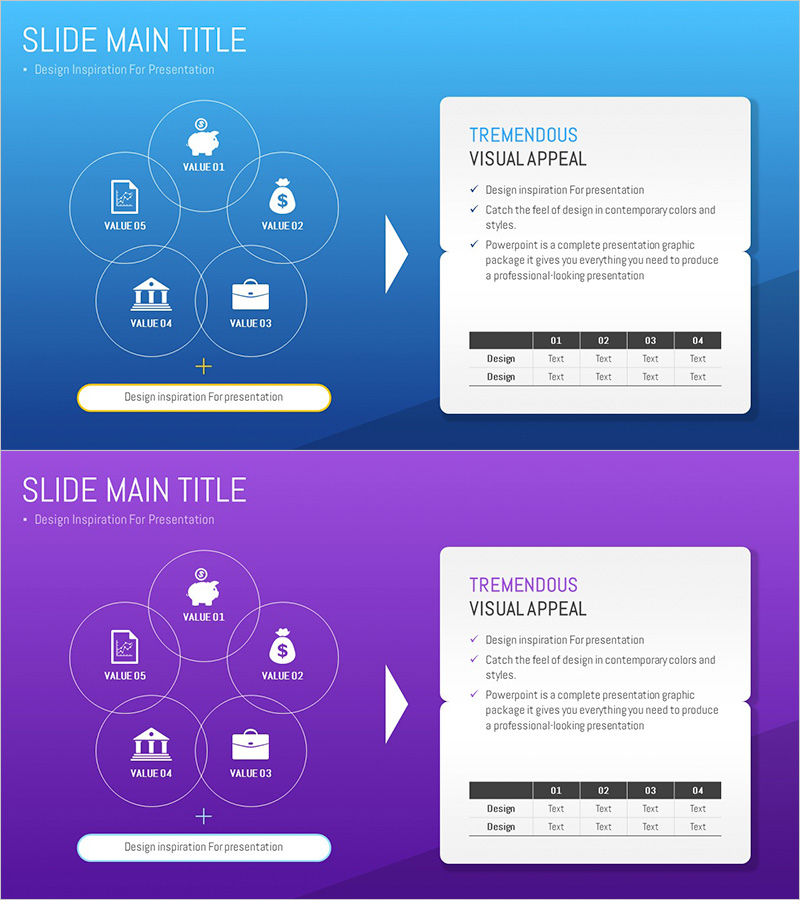
A 5-node nested diagram PowerPoint slide designed for banking services analysis and organization. The structure features a central core element surrounded by five interconnected value nodes (VALUE 01–05) arranged in a circular pattern, visually representing relationships and interactions between different service components. Set against a bright blue background with white icons and typography, the slide delivers excellent readability. The right panel includes detailed descriptions and a comparison table for comprehensive information presentation. This 2-slide set provides both blue and purple color versions, allowing you to match your presentation tone and maintain visual consistency across sections.
Usage Points
-
Main Usage
Systematically analyze and organize multiple banking and financial service elements around a central core concept. The five interconnected value nodes visualize relationships between service components, enabling audiences to grasp the complete service structure at a glance.
-
How to Use
Enter the core service name in the central node and assign specific items (products, features, values, target segments, channels, etc.) to the five surrounding circular nodes. Modify the right panel's text and table to add detailed descriptions and comparative data for each item. Switch between color versions to create visual variety across presentation sections.
-
Recommended For
Ideal for financial and banking sector reports, proposals, and business presentations covering service portfolio analysis, customer value propositions, and competitive comparisons. Also effective in marketing plans for customer segmentation, channel strategy, and product lineup structure explanations.
-
Slide Structure
2-slide set with identical layouts. Each slide features a nested diagram on the left (1 central node + 5 surrounding circular nodes) and an information panel on the right (title, description text, and 4-column comparison table). Blue version (top) and purple version (bottom) provide color flexibility. All elements are fully editable shapes compatible with standard PowerPoint editing.
Related Products
-

Medical Pictogram Overlay Diagram
#Company Introduction #Business Introduction #Diagram
-

Entertainment Business Area Diagram – Dynamics of Business
#Company Introduction #Business Introduction #Diagram
-

Business Area Overlay Diagram – A Blend of Visual Appeal and Functionality
#Company Introduction #Business Introduction #Diagram
-

Diagram Introducing Business Activity Areas – Visualizing Business Areas
#Company Introduction #Business Introduction #Diagram
