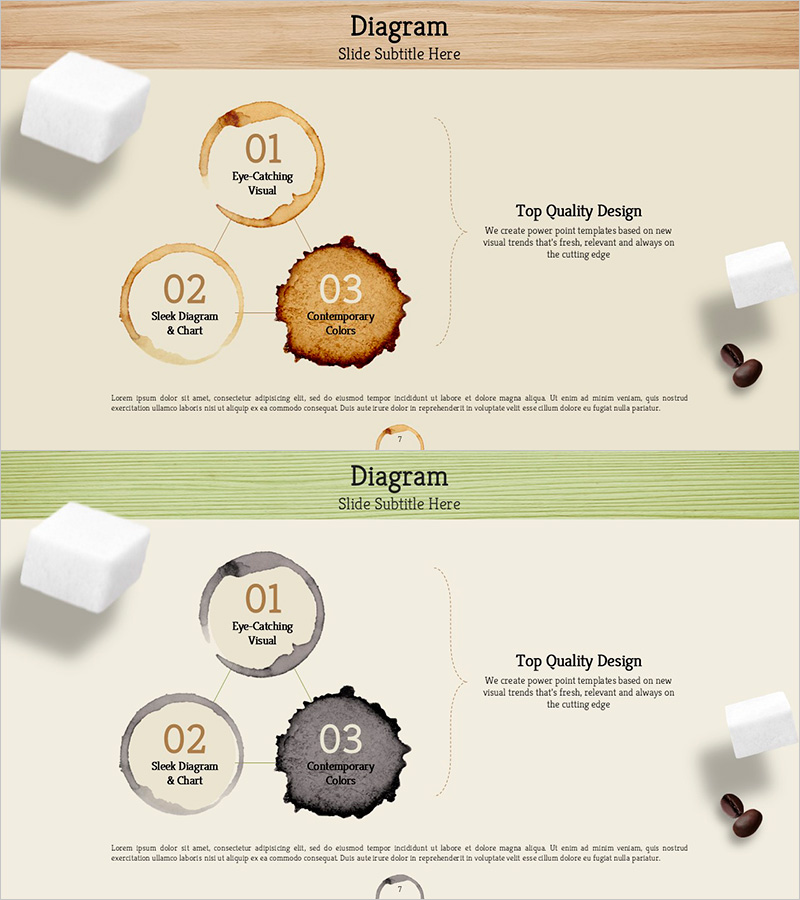
Coffee Imprint Diagram – Visualizing Business Strategy
RJ0600057_6
- Last Update 07/06/2025
- File Size 5MB
- # of Slides 2
- File Format PPTX
- Slide Ratio 16:9
- Color
Keywords
- #Content-Based Slides
- #Design-Based Slides
- #Business Vision and Strategy
- #Diagram
- #Business Strategy
- #Business Goals
- #Cluster
- #Spread
- #Chain Diagram
- #Decentralized Diagram
- #16:9
- #coffee imprint diagram PowerPoint
- #central diagram slide template
- #business strategy visualization
- #3-node diagram
- #strategic planning presentation
- #diagram PowerPoint slide design
About the Product
A PowerPoint slide featuring a coffee imprint central diagram designed to visualize business strategy and vision. The structure places a dark brown central node at the center with two connected nodes positioned at the upper-left and lower-left, effectively expressing the hierarchical relationship between core strategy and detailed execution items. The warm coffee-toned brown and beige background create a professional yet approachable atmosphere, while the right side includes a text area for adding detailed descriptions of each item. The 2-slide set is ideal for presenting strategic initiatives step-by-step and explaining multiple strategy components.
Usage Points
-
Main Usage
Hierarchically present business vision, strategy, and execution plans while clarifying the relationship between core strategy and detailed items. The central node structure allows stakeholders to instantly grasp strategic priorities and interconnections.
-
How to Use
Enter the core strategy or vision in the central dark brown node, and input detailed execution items in the upper-left and lower-left nodes. Add detailed descriptions, objectives, and implementation timelines in the right text area to create a comprehensive strategy presentation.
-
Recommended For
Ideal for executives, strategy teams, and business development teams presenting quarterly or annual business plans, strategy meetings, and investor briefings. Particularly effective when emphasizing the connection between core strategy and execution tasks.
-
Slide Structure
2-slide composition. Each slide features one primary central node (dark brown circle) with two connected nodes (light brown circles) on the left, and a title/description text area on the right. Connection lines between nodes express hierarchical relationships, with a unified beige-toned background throughout.
Related Products
-

Three Routes Toward Innovation – Business Goals and Strategy Diagram
#Business Vision and Strategy #Diagram #Business Strategy
-

Business Connections Circular Diagram – Business Goals and Strategies
#Business Vision and Strategy #Diagram #Business Strategy
-

Successful Business Strategy Diagram – Connecting Business Objectives
#Business Vision and Strategy #Diagram #Business Strategy
-

Key Focus Areas for Service Delivery – Effective Business Objectives Presentation
#Business Vision and Strategy #Diagram #Business Strategy
