SWOT Analysis Diffusion Diagram – Effective Market Analysis Tool
RM0100015_23
- Last Update 01/29/2025
- File Size 3.5MB
- # of Slides 2
- File Format PPTX
- Slide Ratio 16:9
- Color
Keywords
About the Product
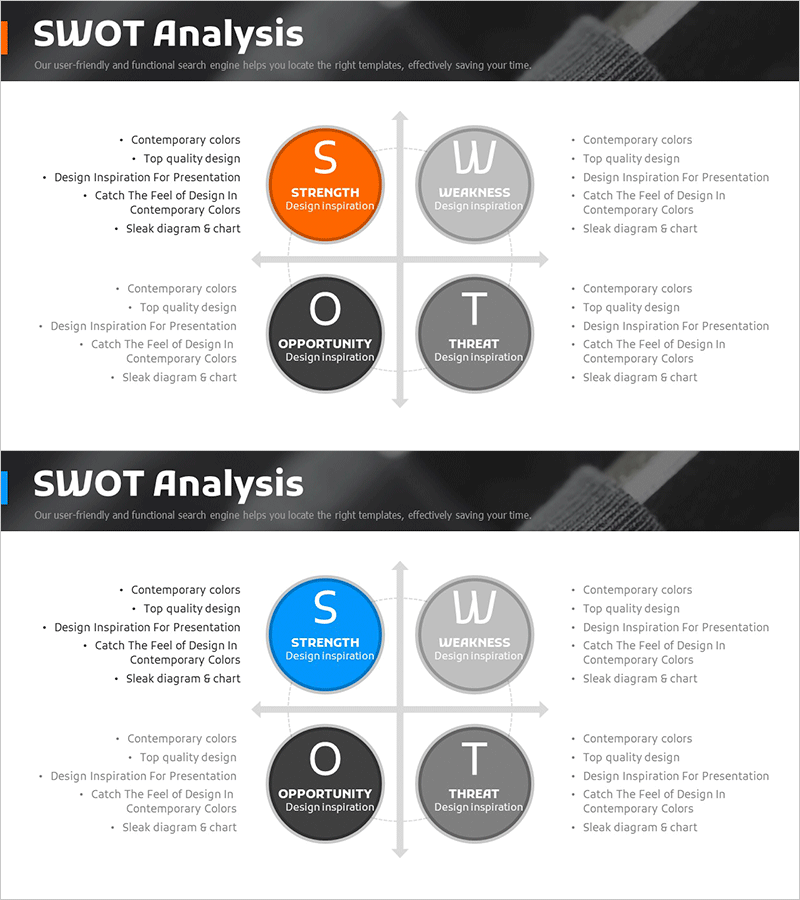
A radial SWOT analysis PowerPoint slide with four quadrants (Strengths, Weaknesses, Opportunities, Threats) arranged symmetrically around a central cross-axis. Orange and blue circular nodes highlight each dimension, while horizontal and vertical arrows clarify the axis relationships. Designed for strategic planning, market analysis, and competitive assessment presentations, this slide enables simultaneous comparison of internal strengths/weaknesses and external opportunities/threats. The 2-slide set offers dual color schemes (orange-blue and blue-gray), with editable text areas below each node for immediate customization and deployment in business reports and strategy documents.
Usage Points
-
Main Usage
Enables comprehensive strategic analysis by simultaneously visualizing internal strengths and weaknesses alongside external opportunities and threats. Accelerates decision-making in marketing planning, business strategy, and competitive intelligence by clearly segmenting four critical strategic dimensions for executive review and board presentations.
-
How to Use
Populate the text areas beneath each circular node (S, W, O, T) with specific business factors relevant to your analysis. The horizontal and vertical axis arrows emphasize the contrast between strengths-weaknesses and opportunities-threats, creating a logical narrative flow during presentation. The 2-slide format with alternate color schemes allows you to apply different SWOT analyses to separate strategic topics or business units.
-
Recommended For
Ideal for C-suite strategy documents, marketing team market analysis reports, management consulting competitive assessments, and startup investor pitch decks. Effective in executive strategy meetings, strategic planning workshops, quarterly business reviews, and investor relations presentations where complex analytical frameworks must be communicated clearly to senior stakeholders.
-
Slide Structure
Central cross-axis (horizontal and vertical arrows) anchors four symmetrically positioned circular nodes: orange (top-left, Strengths), gray (top-right, Weaknesses), black (bottom-left, Opportunities), and gray (bottom-right, Threats). Each node includes 5-6 lines of editable text space below for factor entry. Both slides maintain identical structure with only color palette variation (orange-blue vs. blue-gray) for thematic flexibility.
Related Products
-

SWOT Analysis Leaf Diagram – Essential Template for Market Analysis
#Market and Competitor Analysis #Diagram #SWOT Analysis
-

SWOT Analysis Segmentation Diagram – Market and Competitive Strategy
#Market and Competitor Analysis #Diagram #SWOT Analysis
-

SWOT Circular Segmentation Diagram
#Market and Competitor Analysis #Diagram #SWOT Analysis
-

SWOT Analysis Circular Slice Diagram – Market and Competitor Analysis
#Market and Competitor Analysis #Diagram #SWOT Analysis
