SWOT Analysis Segmentation Diagram – Market and Competitive Strategy
RM0400006_15
- Last Update 02/16/2025
- File Size 0.9MB
- # of Slides 2
- File Format PPTX
- Slide Ratio 16:9
- Color
Keywords
- #Content-Based Slides
- #Design-Based Slides
- #Market and Competitor Analysis
- #Diagram
- #SWOT Analysis
- #Market Analysis
- #Spread
- #Decentralized Diagram
- #16:9
- #SWOT analysis diagram
- #4-segment SWOT PowerPoint slide
- #market analysis presentation
- #competitive strategy diagram
- #SWOT template
- #business strategy slide
About the Product
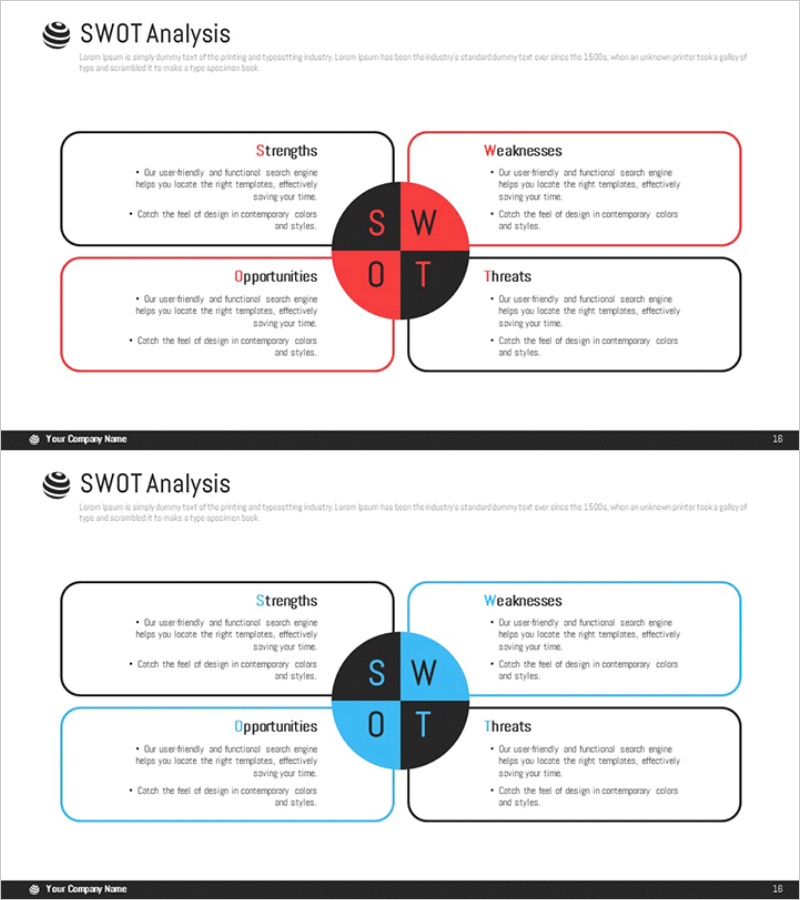
A SWOT analysis diagram PowerPoint slide that divides Strengths, Weaknesses, Opportunities, and Threats into four quadrants around a central circular node. The red and blue dual-tone color scheme visually distinguishes each SWOT element, with dedicated text input areas in every section. Composed of 2 slides in 16:9 widescreen format, this slide deck is ready to use for market analysis, competitive analysis, and business strategy presentations. Ideal for executive briefings, strategic planning sessions, and investor pitch decks to communicate critical decision-making insights effectively.
Usage Points
-
Main Usage
Visualizes a company's Strengths, Weaknesses, Opportunities, and Threats across four quadrants centered on a circular node. This SWOT framework enables clear communication of strategic insights during market analysis, competitive assessment, and business strategy development phases.
-
How to Use
Enter relevant content into each of the four quadrant text boxes (Strengths, Weaknesses, Opportunities, Threats) for your strategic presentation. The dual-tone color scheme (red and blue) intuitively separates positive and negative factors, supporting decision-making in executive briefings, strategy meetings, and investor pitch presentations.
-
Recommended For
Ideal for executives, strategy managers, marketing planners, business development professionals, and consultants presenting corporate strategy and market analysis findings. Perfect for business plans, strategic reports, marketing proposals, and investor relations materials, especially in competitive environment analysis sections.
-
Slide Structure
Consists of 2 slides in 16:9 widescreen format. Each slide features a central circular node with four quadrants: top-left (Strengths, black), top-right (Weaknesses, red), bottom-left (Opportunities, blue), and bottom-right (Threats, black). Each quadrant includes a title and text input area, optimized for modern presentation environments.
Related Products
-

SWOT Analysis Piece Diagram – Essential Tool for Market Analysis
#Market and Competitor Analysis #Diagram #SWOT Analysis
-

SWOT Circular Segmentation Diagram
#Market and Competitor Analysis #Diagram #SWOT Analysis
-

SWOT Analysis Diffusion Diagram – Effective Market Analysis Tool
#Market and Competitor Analysis #Diagram #SWOT Analysis
-

SWOT Analysis Circular Slice Diagram – Market and Competitor Analysis
#Market and Competitor Analysis #Diagram #SWOT Analysis
