Ringer Shape Subdivided Column Graph – Funding Plan and Performance
RM0400006_27
- Last Update 02/16/2025
- File Size 1MB
- # of Slides 2
- File Format PPTX
- Slide Ratio 16:9
- Color
Keywords
About the Product
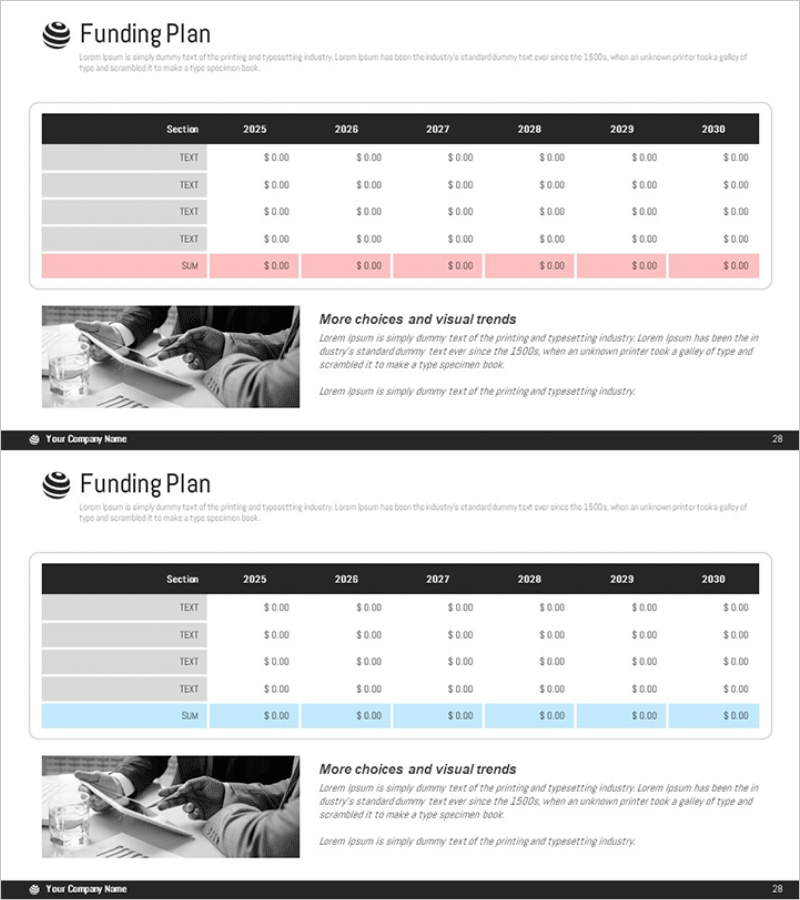
A PowerPoint slide featuring a ringer-shaped subdivided column graph that visualizes funding plans and actual performance from 2025 to 2030. The slide combines a data table with black header and color-coded rows (pink and blue highlights) in the upper section, paired with explanatory text and imagery on the right side. This presentation slide effectively communicates budget allocation, financial performance, and year-over-year comparisons to investors, board members, and executives. The template is fully editable, allowing you to customize numerical values, adjust year ranges, and modify colors to match your corporate branding or presentation theme.
Usage Points
-
Main Usage
This slide presents funding allocation and actual performance metrics side-by-side, enabling clear communication of financial status to stakeholders. The subdivided column structure accommodates multiple funding categories simultaneously, making it ideal for budget analysis, variance reporting, and financial forecasting in executive presentations.
-
How to Use
Insert this slide into investor pitch decks, business plans, and quarterly financial reports. Replace the sample data with your actual figures, adjust the year range as needed, and leverage the color-coded rows to highlight key metrics or variances. The layout supports both summary-level and detailed financial narratives.
-
Recommended For
CFOs, financial analysts, investor relations professionals, business development managers, and executive presenters use this slide to explain funding status and financial performance. Ideal for startup fundraising pitches, corporate earnings presentations, project budget reviews, and strategic planning sessions.
-
Slide Structure
The upper table section contains a section column, six year columns (2025–2030), and four text rows plus a summary row with pink and blue highlighting. The right side features a black-and-white photograph with a 'More choices and visual trends' heading and two lines of descriptive text below.
Related Products
-

Project Funding Plan – Easy to Create Financial Planning Slide
#Financial Plans and Performance #Diagram #Capital Requirements
-

Diagram for Visualizing Financial Plans – Grey Brown Design
#Financial Plans and Performance #Diagram #Capital Requirements
-

Trend Color Wide Template Table – Emphasizing Financial Planning and Performance
#Financial Plans and Performance #Diagram #Capital Requirements
-

Funding Plan Table for Financial Planning Slide
#Financial Plans and Performance #Diagram #Capital Requirements
