Corporate Investment and Financing Profit Statement – Efficient Funding Plan
RM0400013_27
- Last Update 02/18/2025
- File Size 0.6MB
- # of Slides 2
- File Format PPTX
- Slide Ratio 16:9
- Color
Keywords
- #Content-Based Slides
- #Design-Based Slides
- #Financial Plans and Performance
- #Diagram
- #Capital Requirements
- #Key Financial Indicators
- #Table
- #16:9
- #funding plan PowerPoint slide
- #quarterly financial metrics table
- #investment financing presentation
- #budget comparison slide
- #corporate financial data template
About the Product
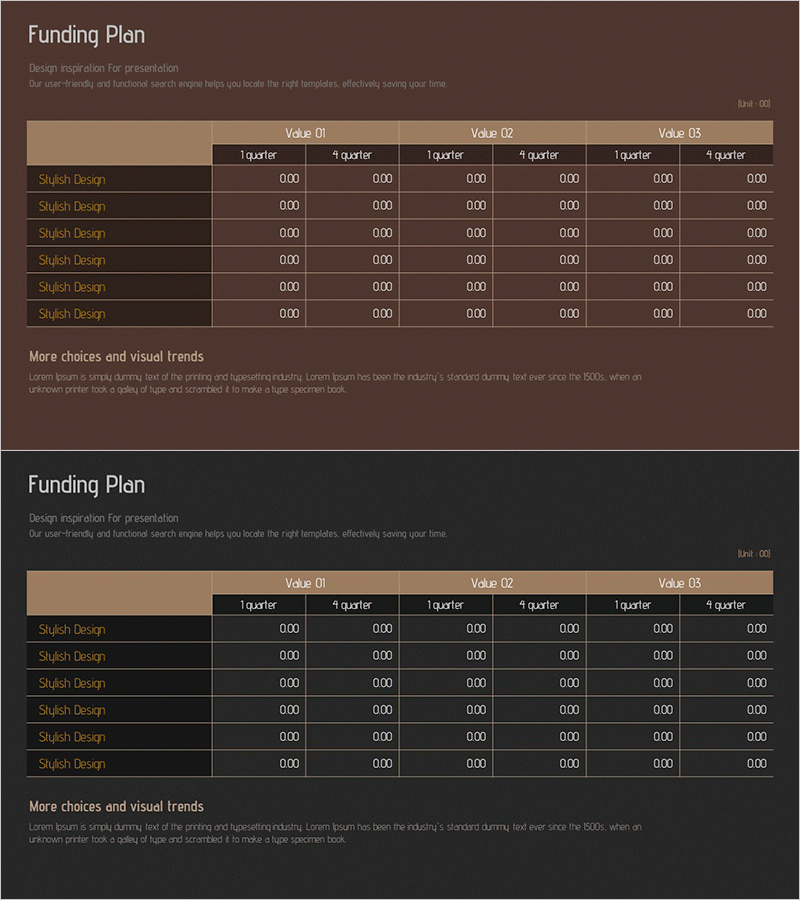
A professional PowerPoint slide designed to compare corporate investment and financing data across quarterly periods. The slide features a brown background with beige header sections, presenting three financial metrics (Value 01, 02, 03) across six quarters (1st-4th quarter). The 2-slide set includes identical layout versions with 6 row labels and 18 data entry cells for comprehensive financial visualization. Ideal for investor presentations, budget reviews, and financial planning discussions where quarterly performance comparison is essential.
Usage Points
-
Main Usage
This slide enables clear comparison of corporate investment funding status and quarterly financial metrics at a glance. Three financial indicators are presented across six quarters in numerical format, effectively communicating cash flow and budget execution status to stakeholders.
-
How to Use
Deploy this slide in investor relations presentations, shareholder meetings, and executive financial reports within the funding plan section. Input actual financial figures into each cell to enable quarterly comparative analysis, and use color highlighting to emphasize key performance indicators.
-
Recommended For
CFOs, financial managers, investor relations specialists, and executive reporting teams presenting funding plans and budget status. Particularly valuable for startup pitch decks, corporate earnings presentations, and financial analysis reports.
-
Slide Structure
Two-slide set with identical table layouts. Each slide features a brown background with beige header, left-aligned row labels (6 items), and right-aligned data cells organized by three financial metrics across six quarters (18 total cells), supporting comprehensive financial data input and quarterly comparison analysis.
Related Products
-

Highlight Table Chart – Clear Visualization of Financial Performance
#Financial Plans and Performance #Diagram #Capital Requirements
-

Project Funding Plan – Easy to Create Financial Planning Slide
#Financial Plans and Performance #Diagram #Capital Requirements
-

Social Network Wide Template Table – Financial Planning and Results
#Financial Plans and Performance #Diagram #Capital Requirements
-

Sleek Diagram for a Trial Table
#Financial Plans and Performance #Diagram #Capital Requirements
