Marketing Cost Analysis Breakdown Graph
RM0400015_26
- Last Update 02/19/2025
- File Size 0.4MB
- # of Slides 2
- File Format PPTX
- Slide Ratio 16:9
- Color
Keywords
- #Content-Based Slides
- #Design-Based Slides
- #Financial Plans and Performance
- #Diagram
- #Graph
- #Projected Return on Investment (ROI)
- #Budget
- #Cluster
- #Horizontal Bar
- #Closed Cluster Diagram
- #Segmented Horizontal Bar
- #16:9
- #stacked bar chart PowerPoint
- #breakdown chart slide template
- #marketing budget analysis presentation
- #cost comparison graph
- #budget trend visualization
About the Product
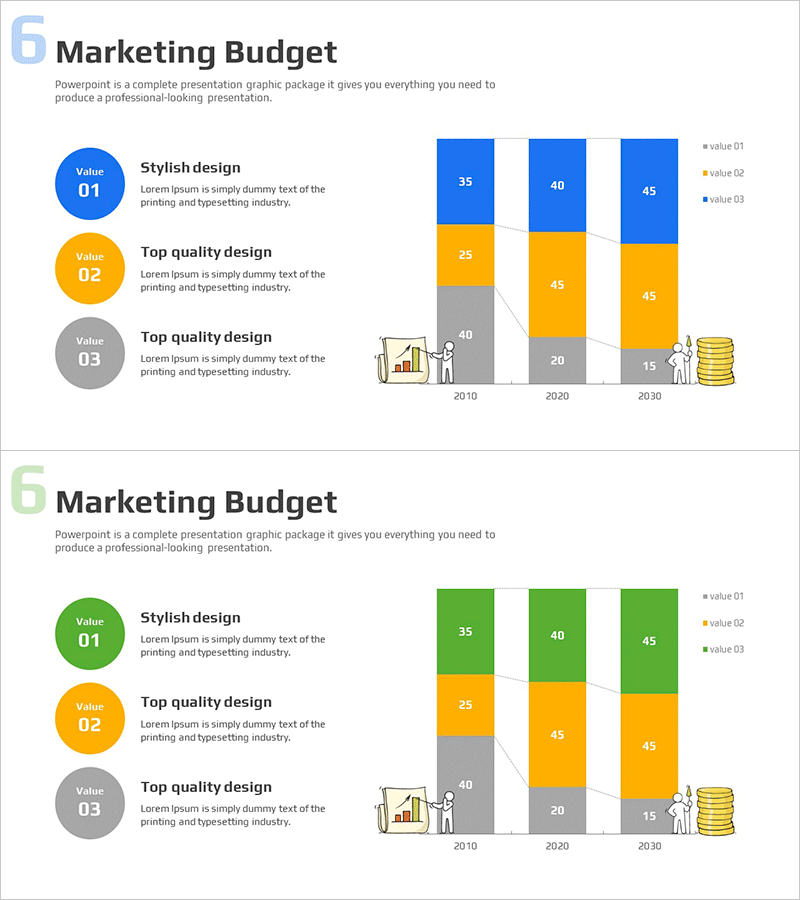
A stacked breakdown bar chart PowerPoint slide that visualizes marketing budget allocation and cost trends across multiple years. The vertical bar chart features three data series in blue, orange, and gray, displaying year-over-year budget changes from 2010 to 2030 with clear data labels. Left-side circular value badges (Value 01, 02, 03) highlight key cost categories, while right-side icons (chart, people, coins) reinforce the financial narrative. This presentation slide is ready to use for marketing planning decks, ROI analysis reports, and budget allocation presentations.
Usage Points
-
Main Usage
Communicate marketing budget composition and year-over-year cost changes using a stacked breakdown bar chart that clearly displays budget structure. Supports financial decision-making in ROI analysis, budget allocation strategy, and cost efficiency reviews for executive presentations.
-
How to Use
Replace the circular value badges on the left with your cost categories (e.g., advertising spend, personnel costs, operational expenses). Update the stacked bar chart values with actual budget data, adjust the legend, and modify data labels to match your presentation context.
-
Recommended For
Marketing managers, financial analysts, CFO teams, and business planners presenting budget status and cost trends. Ideal for quarterly and annual budget comparisons, departmental budget allocation, marketing channel investment analysis, and multi-year financial forecasting.
-
Slide Structure
2-slide set: Slide 1 emphasizes blue color series, Slide 2 features green color series for design variation. Each slide contains left-side 3 circular value badges, center stacked vertical bar chart (3 series × 3 years), and right-side financial icons (chart, people, coins) for visual balance.
Related Products
-

Marketing Budget Allocation Table – Efficient Financial Planning
#Financial Plans and Performance #Diagram #Projected Return on Investment (ROI)
-

3 Detailed Analysis Charts – Marketing Strategy and Performance
#Marketing Plan and Strategy #Financial Plans and Performance #Diagram
-

Estimated Fund Requirements for Construction Projects – Clear Financial Planning
#Financial Plans and Performance #Diagram #Projected Return on Investment (ROI)
-

Medical Business Expected Funding Requirements Table – Efficient Financial Planning
#Financial Plans and Performance #Diagram #Projected Return on Investment (ROI)
