Marketing Budget Allocation Table – Efficient Financial Planning
RM0400009_26
- Last Update 02/17/2025
- File Size 1.4MB
- # of Slides 2
- File Format PPTX
- Slide Ratio 16:9
- Color
Keywords
- #Content-Based Slides
- #Design-Based Slides
- #Financial Plans and Performance
- #Diagram
- #Projected Return on Investment (ROI)
- #Budget
- #Cluster
- #Closed Cluster Diagram
- #16:9
- #marketing budget allocation table PowerPoint
- #budget comparison slide template
- #4-tier investment plan diagram
- #marketing financial planning PPT
- #budget breakdown slide download
About the Product
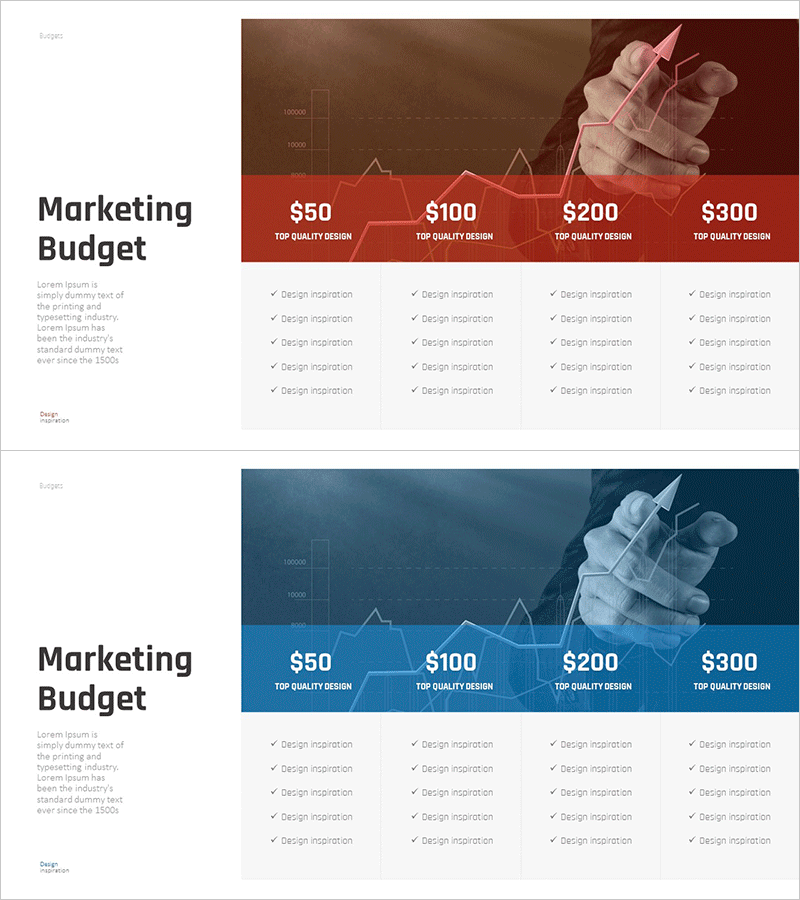
A table-format diagram PowerPoint slide that visualizes marketing budget allocation across four price tiers ($50, $100, $200, $300). Provided in two color versions—red and blue—with checkmark indicators showing design features included at each budget level. The background features a hand image overlaid with a line graph, conveying dynamic financial data trends. This 2-slide set is ready to use for marketing investment planning, budget optimization, and cost-benefit analysis presentations.
Usage Points
-
Main Usage
This slide clearly compares marketing budget allocation across four price tiers with checkmark indicators for included features at each level. It enables stakeholders to instantly assess investment value and cost-effectiveness. Ideal for financial planning, budget optimization, and ROI analysis presentations.
-
How to Use
Enter actual budget amounts in the four price-tier headers and customize the feature checklist for each tier. Use the red version for aggressive investment strategies and the blue version for conservative planning. The background graph area can accommodate additional data visualizations.
-
Recommended For
Recommended for marketing managers, financial planners, and executive presentations. Suitable for advertising budget allocation, marketing investment planning, service package pricing comparison, and project budget phase analysis.
-
Slide Structure
Slide 1 (Red version): Four price-tier boxes at top ($50, $100, $200, $300) with 5-row checkmark table below. Background includes hand image and line graph overlay. Slide 2 (Blue version): Identical structure with color variation. 16:9 widescreen format, 2-slide set.
Related Products
-

Estimated Fund Requirements for Construction Projects – Clear Financial Planning
#Financial Plans and Performance #Diagram #Projected Return on Investment (ROI)
-

Medical Business Expected Funding Requirements Table – Efficient Financial Planning
#Financial Plans and Performance #Diagram #Projected Return on Investment (ROI)
-

Marketing Cost Analysis Breakdown Graph
#Financial Plans and Performance #Diagram #Graph
-

3 Detailed Analysis Charts – Marketing Strategy and Performance
#Marketing Plan and Strategy #Financial Plans and Performance #Diagram
