3 Detailed Analysis Charts – Marketing Strategy and Performance
RJ0900022_19
- Last Update 08/22/2025
- File Size 0.4MB
- # of Slides 2
- File Format PPTX
- Slide Ratio 16:9
- Color
Keywords
- #Content-Based Slides
- #Design-Based Slides
- #Marketing Plan and Strategy
- #Financial Plans and Performance
- #Diagram
- #Graph
- #Promotion Strategy
- #Projected Return on Investment (ROI)
- #Cluster
- #Horizontal Bar
- #Closed Cluster Diagram
- #Segmented Horizontal Bar
- #16:9
- #marketing analysis chart PowerPoint
- #performance comparison slides
- #3-color cluster diagram
- #horizontal bar graph template
- #marketing strategy presentation slides
About the Product
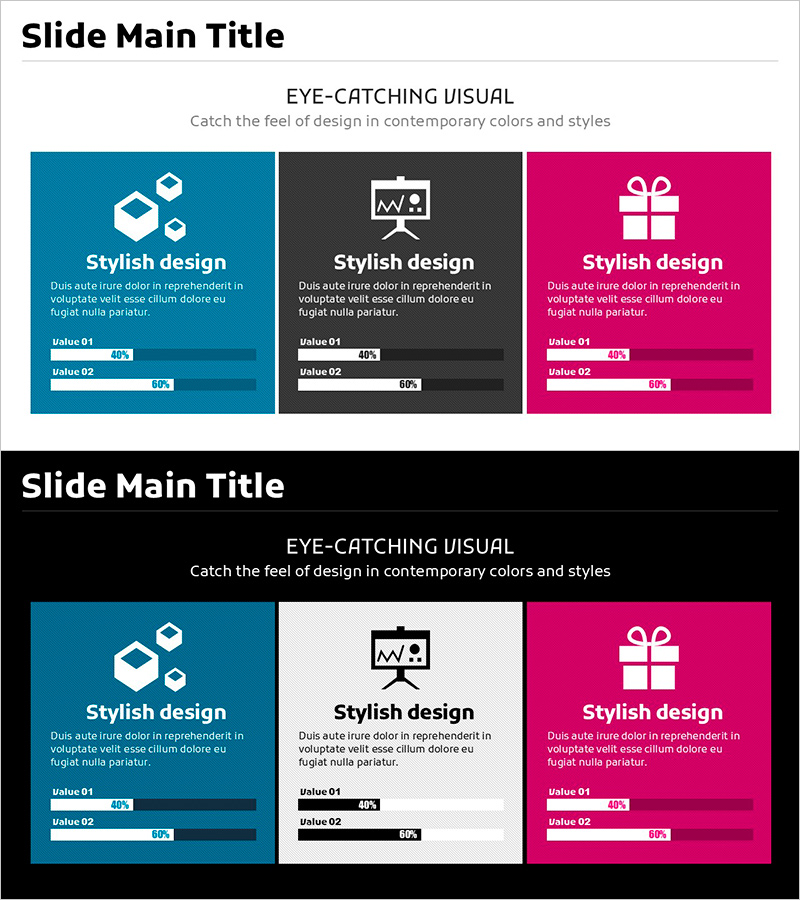
A comprehensive PowerPoint slide deck featuring three detailed analysis charts designed for marketing strategy development and performance evaluation. Each chart combines custom icons with horizontal bar graphs in teal, dark gray, and hot pink color schemes to present data intuitively. The 2-slide presentation includes Value 01 and Value 02 comparative metrics for each section, making it ideal for marketing planning, financial performance reporting, and strategic analysis presentations. Delivered in 16:9 widescreen PPTX format with fully editable elements for immediate customization.
Usage Points
-
Main Usage
Visualizes key marketing metrics during strategy development and performance analysis phases. The three distinct color sections enable simultaneous comparison of different marketing channels, product lines, or time periods, while horizontal bar graphs clearly communicate relative data magnitudes and performance rankings.
-
How to Use
Replace icons, titles, and Value 01/02 items with your marketing data. Colors are fully customizable to match corporate branding, and bar lengths automatically adjust when you input new values, enabling instant graph updates without manual resizing.
-
Recommended For
Marketing managers, strategy planning teams, sales directors, and executive reporting specialists. Ideal for quarterly performance reviews, marketing campaign result analysis, budget allocation decision meetings, and executive-level business reports.
-
Slide Structure
2-slide layout with each slide featuring a title section at the top and three independent cluster areas arranged horizontally. Each cluster contains an icon, heading, and two horizontal bar graphs for comparative metrics. Color-coded sections enable side-by-side analysis and quick performance benchmarking.
Related Products
-

Marketing Cost Analysis Breakdown Graph
#Financial Plans and Performance #Diagram #Graph
-

Market Analysis Graph Ahead of the Future – Innovative Business Insights
#Market and Competitor Analysis #Diagram #Graph
-

Online Market Trends and Design Strategy - Visual Appeal and Data Flow
#Market and Competitor Analysis #Marketing Plan and Strategy #Diagram
-

Business Product Promotion Strategy Slide Template
#Operational Plan #Marketing Plan and Strategy #Diagram
