Business Performance Analysis Monitoring Results – Template to Drive Business Growth
RM0400014_31
- Last Update 02/19/2025
- File Size 1MB
- # of Slides 2
- File Format PPTX
- Slide Ratio 16:9
- Color
Keywords
- #Content-Based Slides
- #Design-Based Slides
- #Business Management
- #Operational Plan
- #Diagram
- #Implementation Plan
- #Post-Implementation Management & Maintenance
- #Flow
- #Linear Flow
- #16:9
- #circular process diagram PowerPoint
- #4-stage cycle slide
- #business performance analysis presentation
- #monitoring results slide template
- #how to create cycle diagram in PowerPoint
About the Product
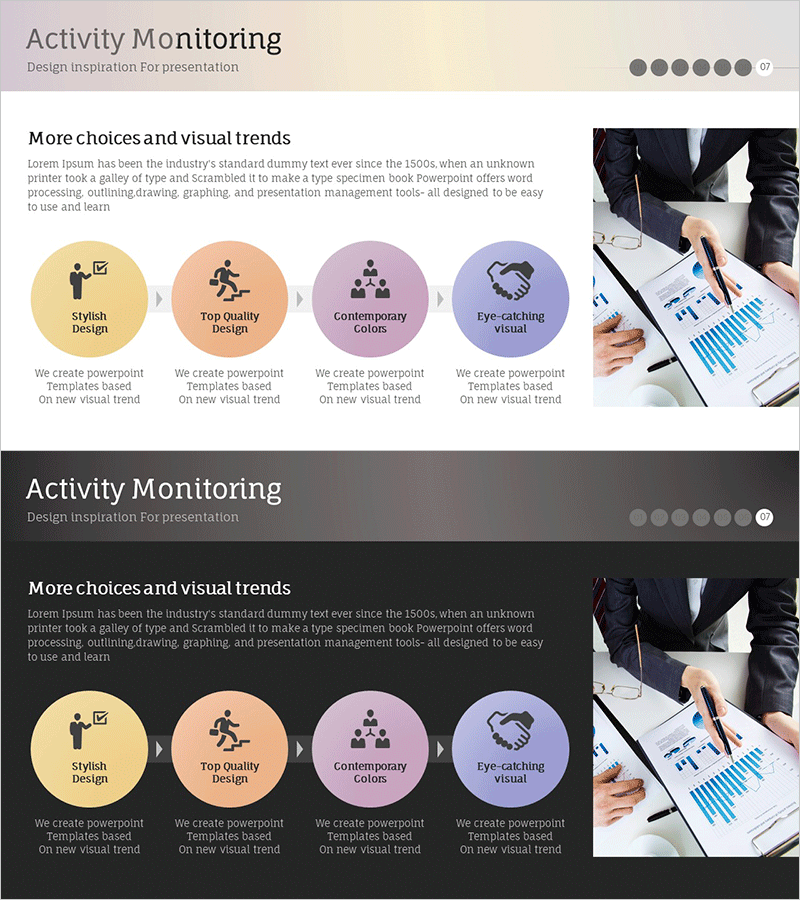
A 4-stage circular process diagram PowerPoint slide designed to visualize business performance analysis and monitoring results. Four color-coded circular nodes (beige, orange, purple, blue) are connected by directional arrows to clearly represent the cyclical structure of business growth. Each stage (Stylish Design, Top Quality Design, Contemporary Colors, Eye-catching Visual) includes dedicated text areas for descriptions, with a business activity photo positioned on the right to enhance presentation impact. The 2-slide set provides both light and dark background versions for flexible use in various presentation environments.
Usage Points
-
Main Usage
Visualize business performance analysis and monitoring data through a 4-stage circular structure to clearly communicate the business growth process flow. Each stage represents key elements (design trends, quality standards, color strategy, visual impact) in a cyclical relationship, emphasizing continuous improvement cycles.
-
How to Use
Use in executive reports, business performance presentations, strategy meetings, and marketing planning sessions to explain analysis results through circular structure. Enter stage names and descriptions in each circular node, insert relevant business activity images in the right photo area to add specificity, and select between light or dark background versions based on presentation venue lighting.
-
Recommended For
Marketing managers, planning teams, executives, consultants, and project managers presenting business performance analysis, monitoring results, process improvements, and strategic initiatives. Particularly effective when emphasizing cyclical improvement processes, continuous monitoring, and iterative workflows.
-
Slide Structure
2-slide set with each slide featuring 4 color-coded circular nodes of equal size connected by clockwise directional arrows in a central circular diagram, with a business activity photo area on the right. First slide has beige background, second has dark background. Both optimized for 16:9 widescreen format.
Related Products
-

Abstract Pattern Template Diagram – Blueprint for Business Strategy
#Business Strategy #Business Management #Diagram
-

Business Market Analysis Text Box - Sleek and Modern Design
#Business Management #Operational Plan #Implementation Plan
-

Step-by-step Schedule Planning Linear Diagram – Clear Strategic Planning
#Business Strategy #Business Management #Diagram
-

Visualizing Business Strategy with Roadmap Diagram – Slide Featuring Marketing Plan
#Business Management #Marketing Plan and Strategy #Diagram
