Marketing Operations Budget Table for Clear Financial Planning
RM0400014_26
- Last Update 02/19/2025
- File Size 0.9MB
- # of Slides 2
- File Format PPTX
- Slide Ratio 16:9
- Color
Keywords
- #Content-Based Slides
- #Design-Based Slides
- #Financial Plans and Performance
- #Diagram
- #Projected Return on Investment (ROI)
- #Budget
- #Table
- #16:9
- #marketing budget table PowerPoint
- #budget comparison slide design
- #financial planning table PPT
- #operations budget presentation
- #how to create budget comparison in PowerPoint
About the Product
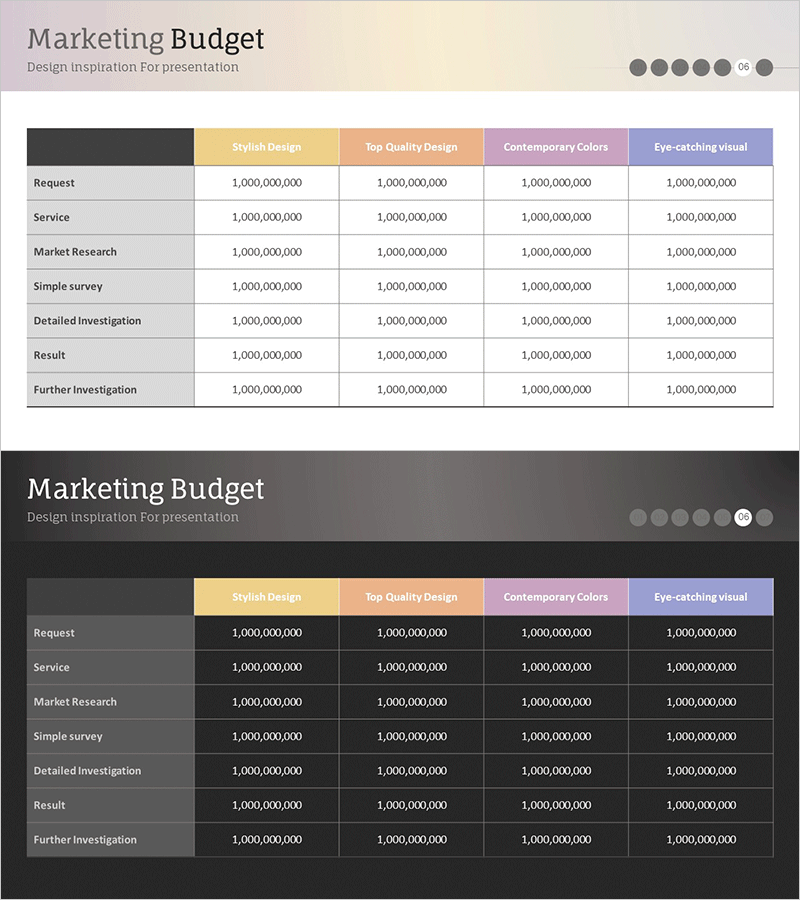
A PowerPoint slide that visualizes marketing operations budget with clear financial data comparison. The slide presents seven budget items (Request, Service, Market Research, Simple Survey, Detailed Investigation, Result, Further Investigation) across four budget categories (Stylish Design, Top Quality Design, Contemporary Colors, Eye-catching Visual) in a structured table format. Each column is distinguished by distinct header colors—yellow, orange, purple, and blue—ensuring easy readability and quick data comprehension. The two-slide set includes both light background (cream) and dark background (black) versions, allowing you to choose the design that best fits your presentation environment.
Usage Points
-
Main Usage
Display marketing department budget allocation transparently and support decision-making through cost comparison across budget categories. Optimized for clearly communicating budget items and figures during financial planning presentations.
-
How to Use
Use this slide in investor relations presentations, executive reports, and marketing strategy meetings to explain budget status. Simply input actual budget figures into each cell for immediate comparative analysis, with color-coded headers providing clear category distinction.
-
Recommended For
CFOs, marketing managers, financial analysts, and executive reporting professionals who need to present budget allocation visually and persuasively. Ideal for marketing budget allocation review meetings and quarterly financial reports.
-
Slide Structure
Two-slide set featuring light background (cream) and dark background (black) versions. Each slide contains a 7-row × 5-column table structure with row headers (budget items) on the left and column headers (four budget categories) at the top for organized information layout.
Related Products
-

Expected Return on Investment Chart – Visualizing Financial Performance
#Financial Plans and Performance #Diagram #Projected Return on Investment (ROI)
-

Estimated Fund Requirements for Construction Projects – Clear Financial Planning
#Financial Plans and Performance #Diagram #Projected Return on Investment (ROI)
-

Estimated Fund Requirements for Real Estate Investment Slide – Foundation of Financial Planning
#Financial Plans and Performance #Diagram #Projected Return on Investment (ROI)
-

Expected Investment Return Calculation Slide
#Financial Plans and Performance #Diagram #Projected Return on Investment (ROI)
