Marketing Budget Planning Plan – Effectively Manage Your Budget
RM0400006_26
- Last Update 02/16/2025
- File Size 0.9MB
- # of Slides 2
- File Format PPTX
- Slide Ratio 16:9
- Color
Keywords
- #Content-Based Slides
- #Design-Based Slides
- #Financial Plans and Performance
- #Diagram
- #Projected Return on Investment (ROI)
- #Budget
- #Table
- #16:9
- #marketing budget table PowerPoint
- #budget management presentation slide
- #marketing budget planning spreadsheet
- #financial data table slide
- #budget comparison analysis PPT
About the Product
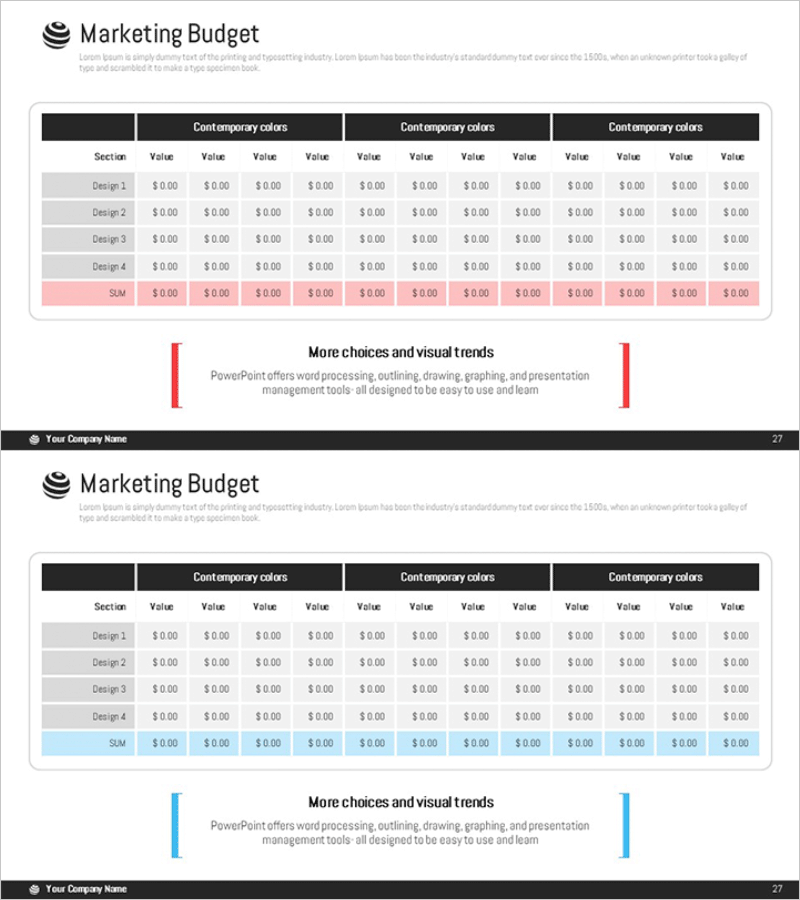
A comprehensive PowerPoint slide for organizing marketing budget planning and execution at a glance. Featuring a multi-comparison table with 4 design rows and 12 columns, you can simultaneously track budget allocation, actual spending, and ROI for each marketing channel. The black header and color-coded rows (gray, pink, blue) provide excellent visual clarity and data hierarchy. This presentation slide is ready to use immediately in financial planning sections or investor reports.
Usage Points
-
Main Usage
This slide visually organizes marketing department budget allocation, execution, and performance results, enabling clear financial reporting to executives and investors. It allows comparative analysis of budget, actual spending, and ROI across different marketing channels (Design 1-4), supporting data-driven decision-making.
-
How to Use
Insert this slide into the financial planning section of business plans, investment pitch decks, or marketing strategy presentations to explain budget status. Enter marketing channel names (social media, email, advertising, events, etc.) in each row and input monthly or quarterly budget figures in the columns. Use the color-coded rows (pink, blue) to highlight totals and target values.
-
Recommended For
Ideal for presentations to marketing managers, finance teams, executives, CFOs, and investors. Particularly effective for startup fundraising pitches, quarterly marketing performance reports, and annual budget planning presentations where data credibility is essential.
-
Slide Structure
2-slide set where the first slide features a black header, gray data rows, and pink summary row, while the second slide uses a blue accent row with the same table structure. Each slide contains 4 input rows + 1 summary row + 12 data columns (48 cells total), optimized for large-scale data entry and multi-channel budget tracking.
Related Products
-

Medical Business Expected Funding Requirements Table – Efficient Financial Planning
#Financial Plans and Performance #Diagram #Projected Return on Investment (ROI)
-

Expected Return on Investment Chart – Visualizing Financial Performance
#Financial Plans and Performance #Diagram #Projected Return on Investment (ROI)
-

Business Budget Summary Table – Visualizing Financial Plans and Performance
#Financial Plans and Performance #Diagram #Projected Return on Investment (ROI)
-

Estimated Fund Requirements for Real Estate Investment Slide – Foundation of Financial Planning
#Financial Plans and Performance #Diagram #Projected Return on Investment (ROI)
