Market Share Change Donut Graph – The Perfect Tool for Accurate Analysis
RM0400010_8
- Last Update 02/17/2025
- File Size 0.4MB
- # of Slides 2
- File Format PPTX
- Slide Ratio 16:9
- Color
Keywords
- #Content-Based Slides
- #Design-Based Slides
- #Product/Service Introduction
- #Market and Competitor Analysis
- #Graph
- #Development Status
- #Market Share
- #Circles
- #Doughnut Chart
- #16:9
- #donut chart PowerPoint slide
- #pie chart presentation template
- #market share visualization
- #3-segment donut graph
- #sales ratio comparison slide
About the Product
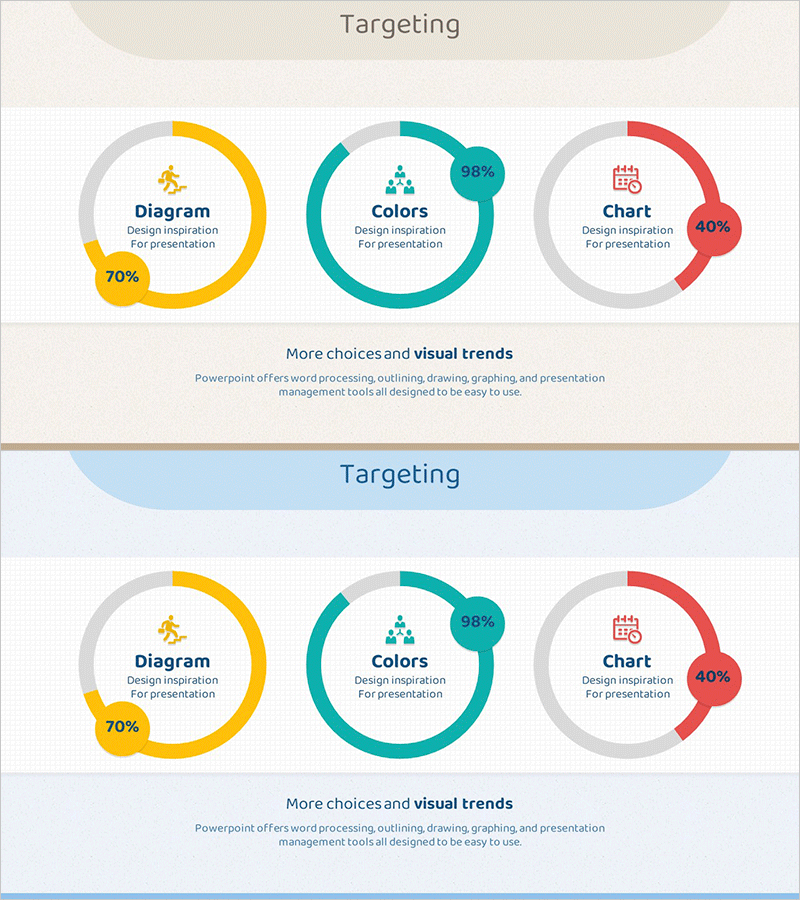
A donut chart PowerPoint slide designed to compare three data categories such as market share, sales ratio, and customer composition at a glance. The slide uses three distinct colors—yellow, teal, and red—to clearly differentiate each segment, with percentage values displayed in the center for intuitive data interpretation. The 2-slide set includes two background versions: a light beige and a blue background, allowing you to match your presentation's overall tone. Provided in 16:9 widescreen PPTX format for immediate editing and use.
Usage Points
-
Main Usage
Visualize market share, sales ratios, and customer composition across three categories in corporate presentations, market analysis reports, and business plans. The centered percentage values ensure clear and accurate data communication to support decision-making.
-
How to Use
Open the slide and modify each donut segment's color and percentage to match your data. Select either the light beige or blue background version that best fits your presentation's design theme. All text and numerical values are fully editable.
-
Recommended For
Marketing managers, executives, financial analysts, and consultants who need to present quantitative data persuasively. Ideal for quarterly performance reviews, competitive analysis, and customer segmentation strategy presentations.
-
Slide Structure
2-slide set with three donut charts arranged horizontally on each slide. Each donut is divided into three segments colored in yellow, teal, and red. Percentage values are displayed in the center of each donut. The first slide features a light beige background, while the second uses a blue background.
Related Products
-

Development Status Analysis Donut Chart – Market Share Visualization
#Product/Service Introduction #Market and Competitor Analysis #Graph
-

Business Idea Development Status Graph – Ideas and Growth
#Product/Service Introduction #Market and Competitor Analysis #Graph
-

Graph of Analysis of Transportation Development Status
#Product/Service Introduction #Market and Competitor Analysis #Graph
-

Analysis of Transportation Usage Status – Pie Chart
#Product/Service Introduction #Market and Competitor Analysis #Graph
