Marketing Financial Strategy Report – Efficient Budget Management
RM0400010_26
- Last Update 02/17/2025
- File Size 0.7MB
- # of Slides 2
- File Format PPTX
- Slide Ratio 16:9
- Color
Keywords
- #Content-Based Slides
- #Design-Based Slides
- #Financial Plans and Performance
- #Diagram
- #Projected Return on Investment (ROI)
- #Budget
- #Table
- #16:9
- #marketing budget table PowerPoint
- #budget management slide design
- #3-column comparison table
- #financial data table PPT
- #marketing performance analysis slide
About the Product
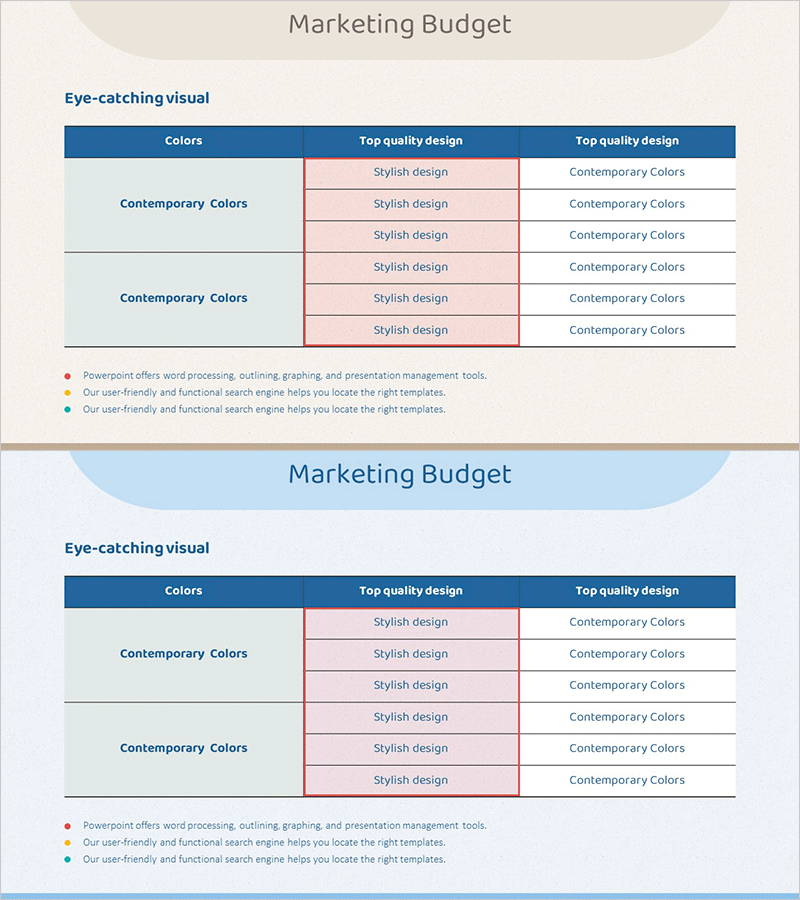
A professional PowerPoint slide designed for marketing financial strategy reports, enabling side-by-side comparison of budget allocation and performance metrics. The 3-column table layout features a navy header and pink accent areas for clear category differentiation. With 2 slides included, you can efficiently visualize various budget line items and KPIs while maintaining data clarity. The text-based structure allows flexible input of numerical data and descriptions, making it ideal for presenting budget analysis and financial performance in presentations and reports.
Usage Points
-
Main Usage
This slide enables simultaneous comparison and analysis of budget allocation and performance indicators in marketing financial strategy reports. The navy header and pink accent areas create visual hierarchy, while the 3-column structure systematically organizes categorical data for executive-level decision making.
-
How to Use
Enter marketing channels (digital, offline, events, etc.) in each row, then populate the three columns with budget amounts, actual spending, and performance metrics. Use the pink accent areas to highlight key performance indicators (KPIs) or achievement rates. Leverage both slides for quarterly or channel-based comparative analysis.
-
Recommended For
Marketing managers, finance professionals, and executives reviewing budget status and performance in meetings and reports. Ideal for quarterly marketing performance reviews, budget reallocation discussions, and executive-level financial presentations requiring data-driven decision support.
-
Slide Structure
2-slide set with each slide containing a 3-column table (Colors, Top quality design, Contemporary Colors) and 6 data entry rows. The navy header row is fixed for consistency, while pink accent areas can be used to highlight critical items. Text-based structure allows flexible editing of numerical and descriptive content.
Related Products
-

Estimated Fund Requirements for Real Estate Investment Slide – Foundation of Financial Planning
#Financial Plans and Performance #Diagram #Projected Return on Investment (ROI)
-

Expected Investment Return Calculation Slide
#Financial Plans and Performance #Diagram #Projected Return on Investment (ROI)
-

Marketing Budget Analysis Table – Optimized for Financial Performance
#Financial Plans and Performance #Diagram #Projected Return on Investment (ROI)
-

Startup Funding Needs Analysis Chart
#Financial Plans and Performance #Diagram #Projected Return on Investment (ROI)
