Marketing Effectiveness Analysis Slide – Cluster Diagram for Operational Planning
RM0400009_32
- Last Update 02/17/2025
- File Size 1.8MB
- # of Slides 2
- File Format PPTX
- Slide Ratio 16:9
- Color
Keywords
- #Content-Based Slides
- #Design-Based Slides
- #Business Management
- #Operational Plan
- #Diagram
- #Implementation Schedule
- #Project Implementation Schedule
- #Cluster
- #Chain Diagram
- #16:9
- #cluster diagram PowerPoint
- #timeline diagram slide template
- #marketing analysis presentation
- #4-node connection diagram
- #operational planning PowerPoint slide
- #diagram PowerPoint template download
About the Product
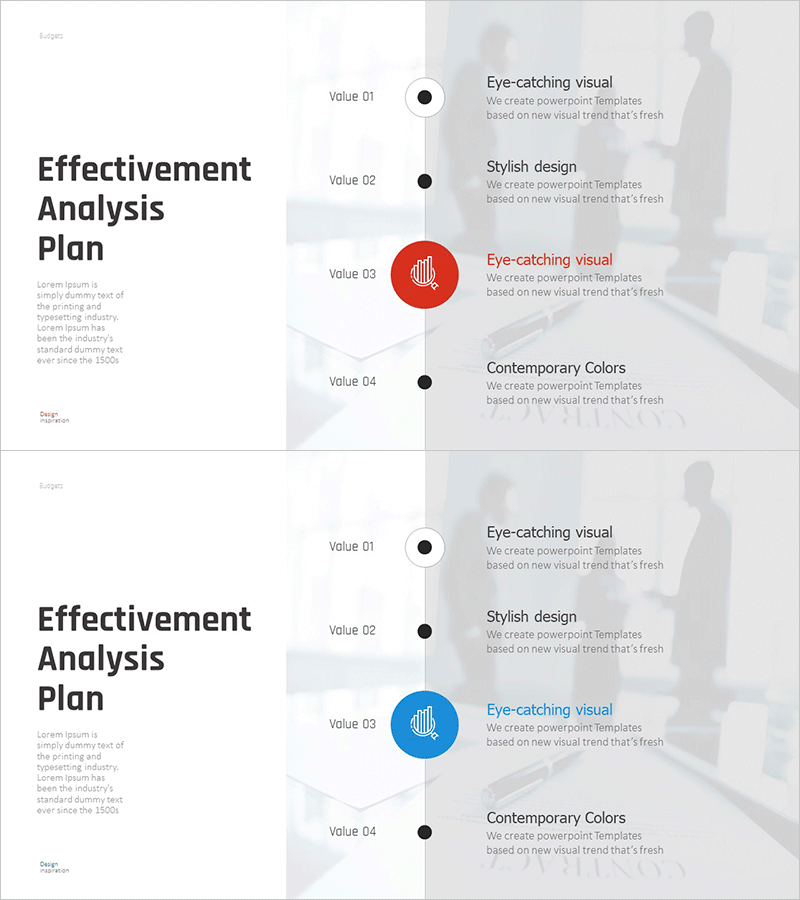
A timeline-based cluster diagram PowerPoint slide designed for marketing effectiveness analysis and operational planning presentations. The design features a central vertical timeline with four key value nodes (Value 01–04) positioned symmetrically on both sides, creating a balanced visual hierarchy. Red and blue accent circles highlight the primary node while black and white circles support secondary information, contrasting against a professional background image. The two-slide set includes color variations (red and blue versions) allowing you to match your brand identity and presentation context. Each node includes dedicated text areas for detailed descriptions and metrics.
Usage Points
-
Main Usage
Present marketing effectiveness analysis results by structuring four key performance indicators along a timeline axis. The symmetrical node arrangement creates visual balance while the colored accent circles draw attention to primary metrics, enabling clear communication of complex marketing data to stakeholders.
-
How to Use
Enter marketing metrics (reach, conversion rate, ROI, customer satisfaction, etc.) and descriptions into each Value section's text areas. Select the red or blue color version matching your corporate branding. The background image can be retained or replaced with your company imagery. Both slides maintain identical structure for consistent presentation flow.
-
Recommended For
Marketing team campaign effectiveness presentations, executive performance review reports, quarterly and annual business reviews, marketing strategy planning meetings, and stakeholder briefings requiring simultaneous comparison of four key performance indicators.
-
Slide Structure
A central vertical timeline serves as the axis with four nodes arranged symmetrically—two on the left and two on the right. Each node consists of one colored accent circle (red or blue) paired with three black and white circles, accompanied by title and description text areas to the right. Both slides share identical structure with color variation only.
Related Products
-

Effectiveness Analysis Connector Diagram and Subdivided Column Graph
#Business Management #Operational Plan #Diagram
-

Linear Diagram Slide for Future Food Service Project Promotion Plan
#Business Management #Operational Plan #Diagram
-

Schedule Management Diagram - Blue Pink Theme
#Business Management #Operational Plan #Diagram
-

Marketing Effectiveness Analysis Diagram – A Visual Overview for Effective Business Execution!
#Business Management #Operational Plan #Diagram
