Marketing Effectiveness Analysis Diagram – A Visual Overview for Effective Business Execution!
RM0400004_32
- Last Update 02/15/2025
- File Size 2MB
- # of Slides 2
- File Format PPTX
- Slide Ratio 16:9
- Color
Keywords
- #Content-Based Slides
- #Design-Based Slides
- #Business Management
- #Operational Plan
- #Diagram
- #Text Box
- #Implementation Schedule
- #Project Implementation Schedule
- #Cluster
- #Chain Diagram
- #Speech Bubble
- #16:9
- #circular diagram PowerPoint
- #marketing effectiveness analysis slide
- #3-stage cycle diagram
- #process flow PowerPoint template
- #marketing analysis presentation slide
About the Product
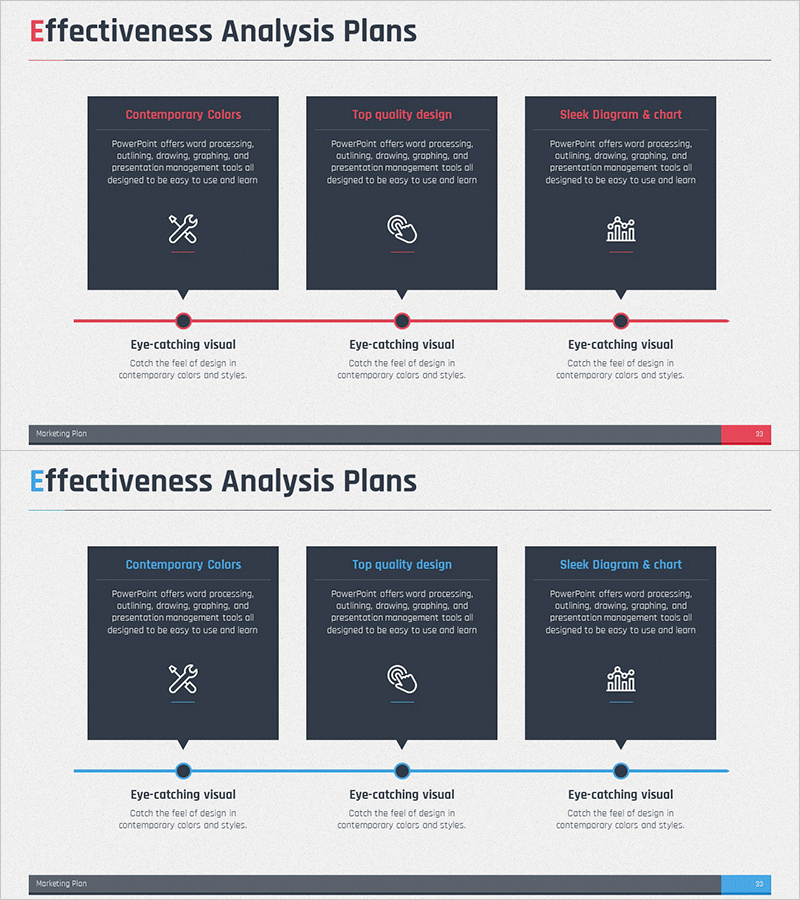
A circular diagram PowerPoint slide designed for marketing effectiveness analysis presentations. The three-node cycle structure with connecting arrows visualizes the marketing strategy cycle of planning, execution, and evaluation. Set against a dark navy background with red and blue accent colors to clearly distinguish each stage. The layout features icons and text descriptions at the top, with an additional information section at the bottom, making it suitable for both presentation decks and business reports. This 2-slide set can be immediately applied to various marketing analysis scenarios.
Usage Points
-
Main Usage
Visually represent the marketing strategy cycle of planning, execution, and evaluation to clearly communicate the effectiveness analysis process. The three-stage circular structure emphasizes continuous improvement loops while effectively organizing key activities and results for each stage.
-
How to Use
Insert into the marketing effectiveness analysis section of marketing plans, business reports, or strategy presentations. Enter specific marketing activities (ad campaigns, performance measurement, strategy refinement) into each node, and fill the bottom text area with numerical results or key insights to complete the slide.
-
Recommended For
Ideal for marketing managers, planning teams, and executives analyzing marketing effectiveness and presenting improvement strategies. Particularly suitable for quarterly or annual marketing performance reviews, campaign effectiveness analysis, and marketing ROI evaluation presentations.
-
Slide Structure
2-slide set with dark navy background featuring a 3-node circular diagram on each slide. Top section contains title, icons, and stage-specific description text. Center displays three boxes connected by arrows in a cycle pattern. Bottom section provides an additional information input area for supplementary data.
Related Products
-

Marketing Effectiveness Analysis Slide – Cluster Diagram for Operational Planning
#Business Management #Operational Plan #Diagram
-

Linear Diagram Slide for Future Food Service Project Promotion Plan
#Business Management #Operational Plan #Diagram
-

Effectiveness Analysis Connector Diagram and Subdivided Column Graph
#Business Management #Operational Plan #Diagram
-

Triangular Pattern Presentation Template – Schedule Table
#Business Management #Operational Plan #Text Box
