Corporate Investment and Financing Analysis Chart – Effective Fund Management Solutions
RM0400009_27
- Last Update 02/17/2025
- File Size 0.6MB
- # of Slides 2
- File Format PPTX
- Slide Ratio 16:9
- Color
Keywords
- #Content-Based Slides
- #Design-Based Slides
- #Market and Competitor Analysis
- #Financial Plans and Performance
- #Diagram
- #Graph
- #Competitor Analysis
- #Key Financial Indicators
- #Table
- #Line
- #Line Chart
- #16:9
- #line chart PowerPoint
- #investment financing analysis slide
- #dual-series trend chart
- #financial planning template
- #how to create line graph in PowerPoint
About the Product
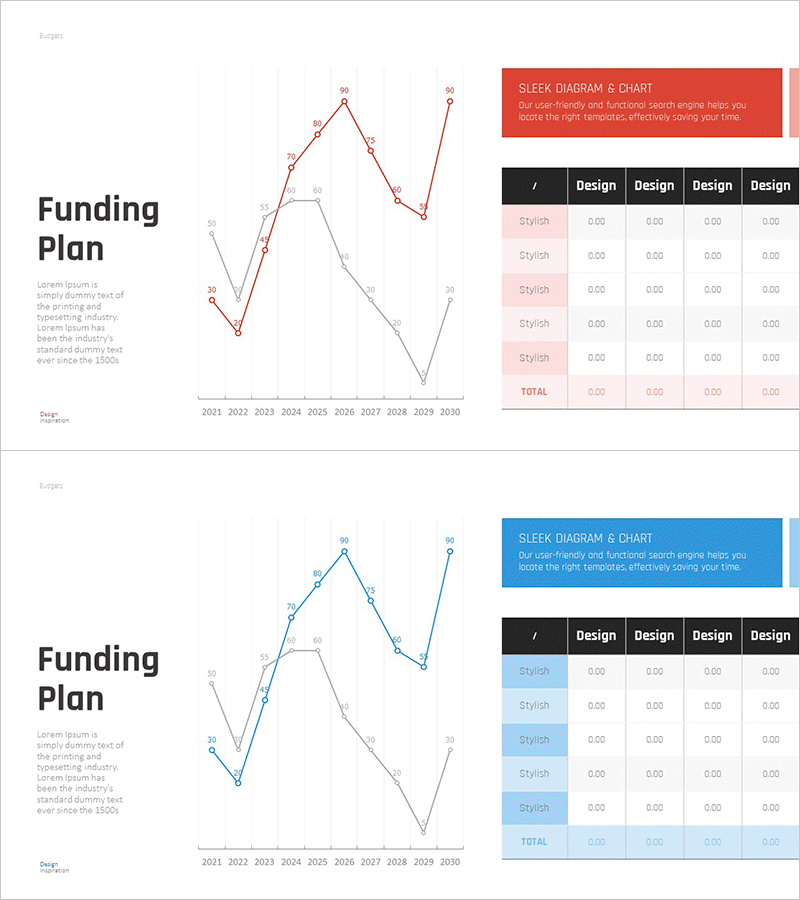
A PowerPoint slide that visualizes investment and financing trends using a dual-series line chart spanning 2021 to 2030. The chart uses red and gray lines to distinguish between two data series, with numeric labels at each data point for precise value comparison. The left section provides space for investment plan descriptions, while the right side includes a table for detailed style-based information input. This presentation template is ideal for corporate financial reports, investor pitch decks, and fund management strategy presentations where trend visualization is essential.
Usage Points
-
Main Usage
Displays corporate investment scale changes, fund acquisition trends, and financial performance fluctuations over time. The dual-series line format effectively compares budget versus actual spending, planned versus realized outcomes, or departmental investment allocations.
-
How to Use
Enter the investment plan title in the left 'Funding Plan' section and describe the investment background, objectives, and expected outcomes in the text area. Modify the line chart data points and values to reflect actual fund amounts, then populate the right table with detailed style-specific items to complete the slide.
-
Recommended For
CFOs, finance managers, investment officers, and executives presenting fund utilization status. Startups pitching to investors to explain fund allocation plans. Corporations reporting financial performance at shareholder meetings or board meetings.
-
Slide Structure
Two-slide set with consistent layout: left section (40%) contains title and descriptive text, center (50%) features a dual-series line chart covering 2021–2030 with approximately 10 data points per line in red and gray, and right section (10%) includes a 5-row table for data input. Both slides maintain identical structure for cohesive presentation flow.
Related Products
-

Competitor Market Analysis Table – Strategic Insights
#Market and Competitor Analysis #Diagram #Graph
-

Apparel Industry Market Analysis Graph – Visualizing Growth Statistics
#Market and Competitor Analysis #Diagram #Graph
-

Target Market Analysis Line Graph – Visualizing Market Status
#Market and Competitor Analysis #Diagram #Graph
-

Target Market Trend Analysis Graph by Year – Market and Competitor Analysis
#Market and Competitor Analysis #Diagram #Graph
